


- 28 April 2026
- |
- 13:29
Monero climbed from $320 to $405 between April 7 and April 26 with spot takers buy dominant every single session and retail futures activity registering neutral for the entire move.
- XMR price at $377: Above 200MA and below 50MA ($386.44).
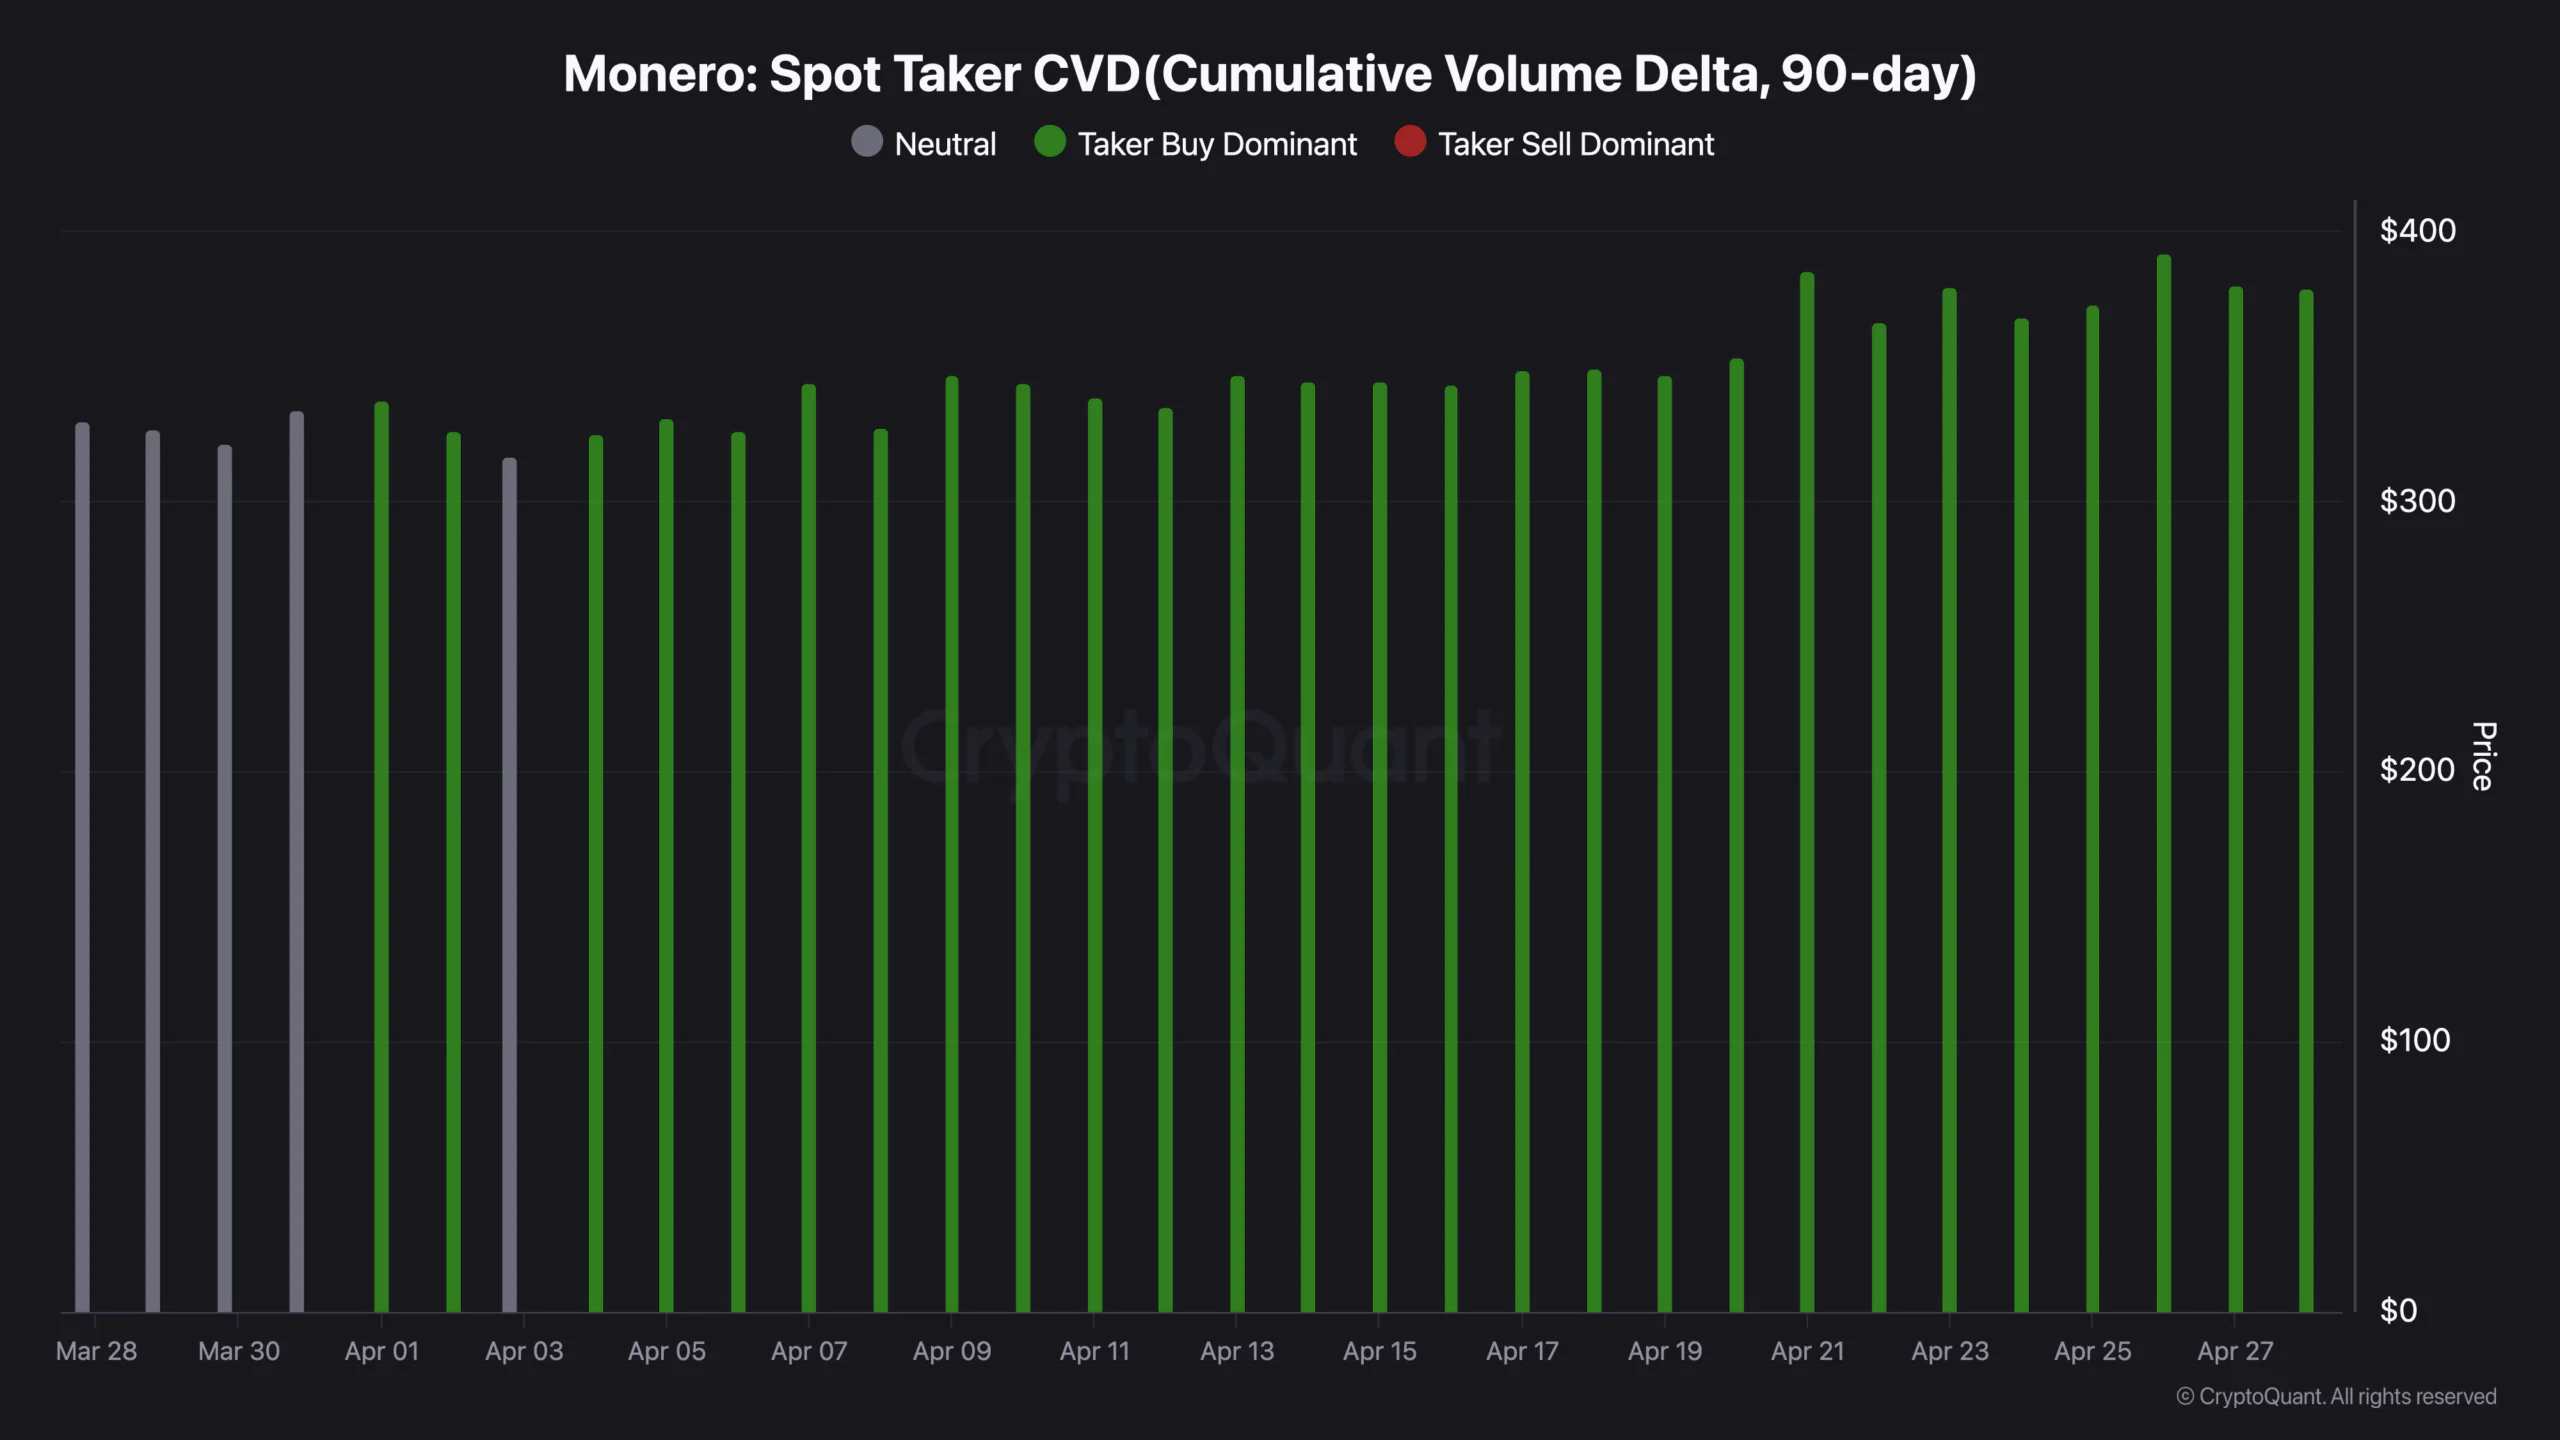
- Spot taker CVD: buy dominant every session from April 4 to April 27.
- Futures " >Futures taker CVD: sell dominant April 10 through April 24, flipped green April 27.
A type of derivative contract that outlines an agreement to buy or sell a specific asset at a predetermined price on a specified future date.
- Retail futures activity: neutral grey for all of April, zero crowd participation.
- January-February 2026 blowoff: Too Many Retail at $650-$750, collapse to $290.
- RSI " >RSI(14) at 42.28, pulling back toward oversold after $405 peak.
Relative Strenght Index
- First session of spot and futures CVD alignment: April 27.
The Rally Retail Missed
The most significant fact about Monero’s April rally is not that it happened. It is who was absent while it did. Spot takers drove price from $320 to $405 with the futures retail activity chart showing neutral grey for every single session. No pink dots. No red dots. The crowd that drove the January blowoff to $750 was not present for any of it.
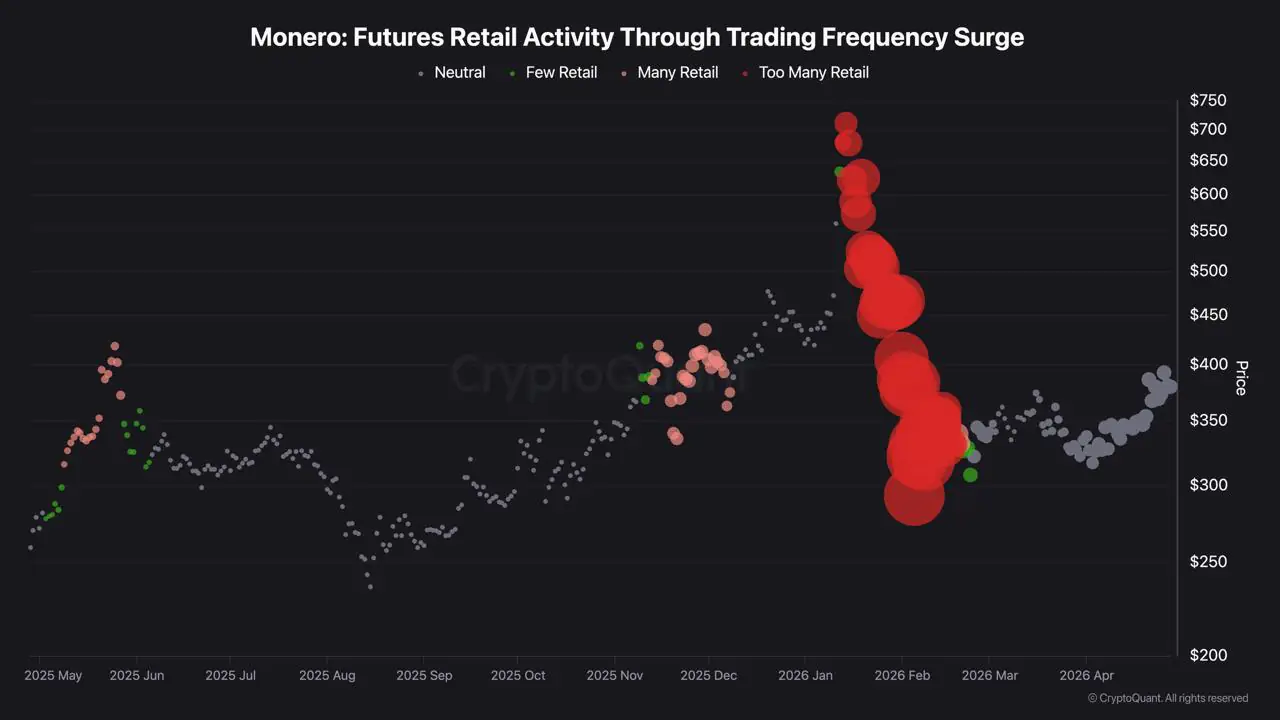
The retail trading frequency chart covering May 2025 through April 2026 explains why. The January to February 2026 blowoff concentrated retail at prices between $450 and $750. The subsequent collapse to $290 in March liquidated that entire cohort. The one isolated green data point at the March low near $295 marks capitulation, the last retail participant exiting. Since then the chart shows neutral grey: an asset recovering without the crowd that got hurt on the way down.
Moves driven by fresh retail inflows are fragile because the same actors who pushed price up are the first to exit when it reverses. Whoever drove XMR from $320 to $405 in April survived the entire collapse from $750 and chose to add at the bottom. That is a different category of holder.
Spot Bought For Four Weeks While Futures Shorted
The spot taker CVD chart shows buy dominance in every session from April 4 through April 27, 24 consecutive periods without a single sell-dominant reading. The bars grow visibly larger in the final week as price accelerated from $355 to $405. Spot buyers were not just present; they were increasing their aggression as price rose.
The futures taker CVD data from CryptoQuant tells the opposite story. From April 10 through April 24, futures takers were sell dominant in nearly every session. The data supports the hedging reading over the short-squeeze reading for one reason: a Short squeeze
" >short squeeze that runs around 26% over three weeks does not produce 24 consecutive sessions of spot buy dominance. It produces a sharp spike and reversal. The sustained, compounding nature of the spot CVD points to accumulation. Spot buyers building physical Monero positions while hedging via futures short would produce exactly this pattern: sustained spot buy dominance paired with sustained futures sell dominance, a basis trade rather than a directional bet.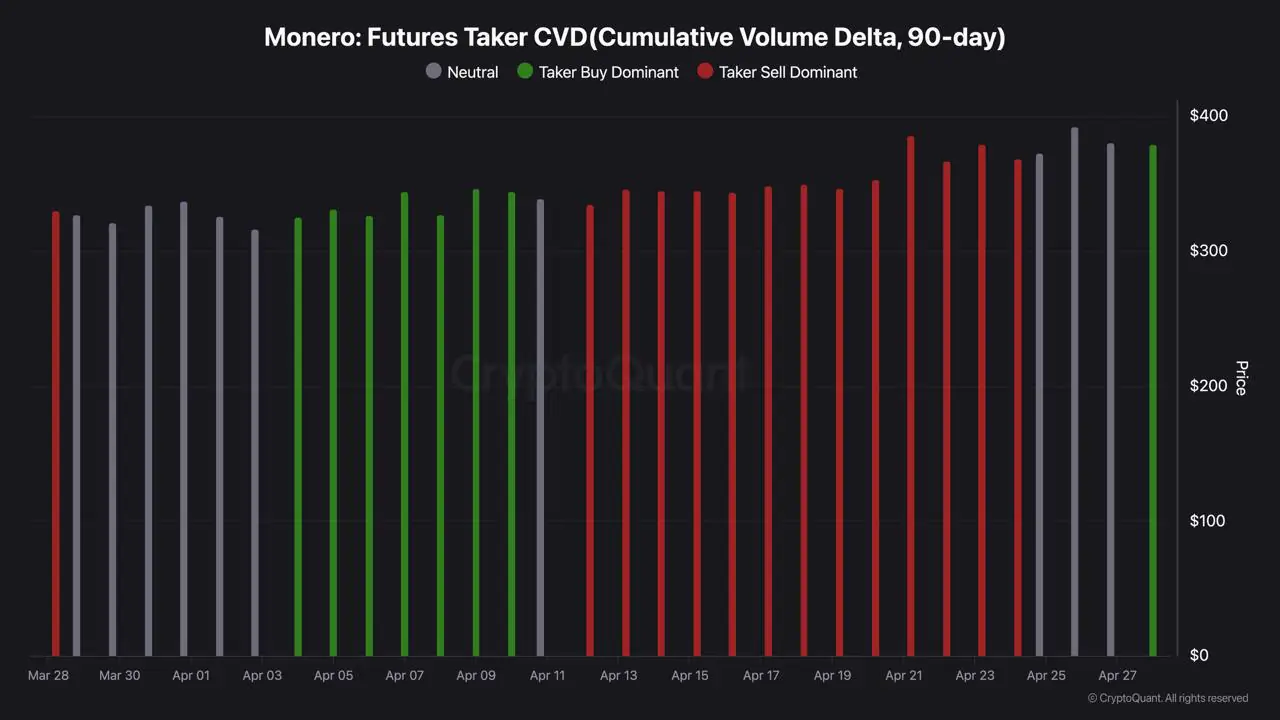
What The Moving Average Stack Says About This Pullback
At $377.66, XMR is sitting in the only part of the MA
" >MA stack where the pullback is still constructive. The 200MA at $374.56 is $3.10 below. The 100MA at $379.76 is $2.10 above. The 50MA at $386.44 is $8.78 above. Below $374.56, the structure breaks. Above $379.76, it resumes.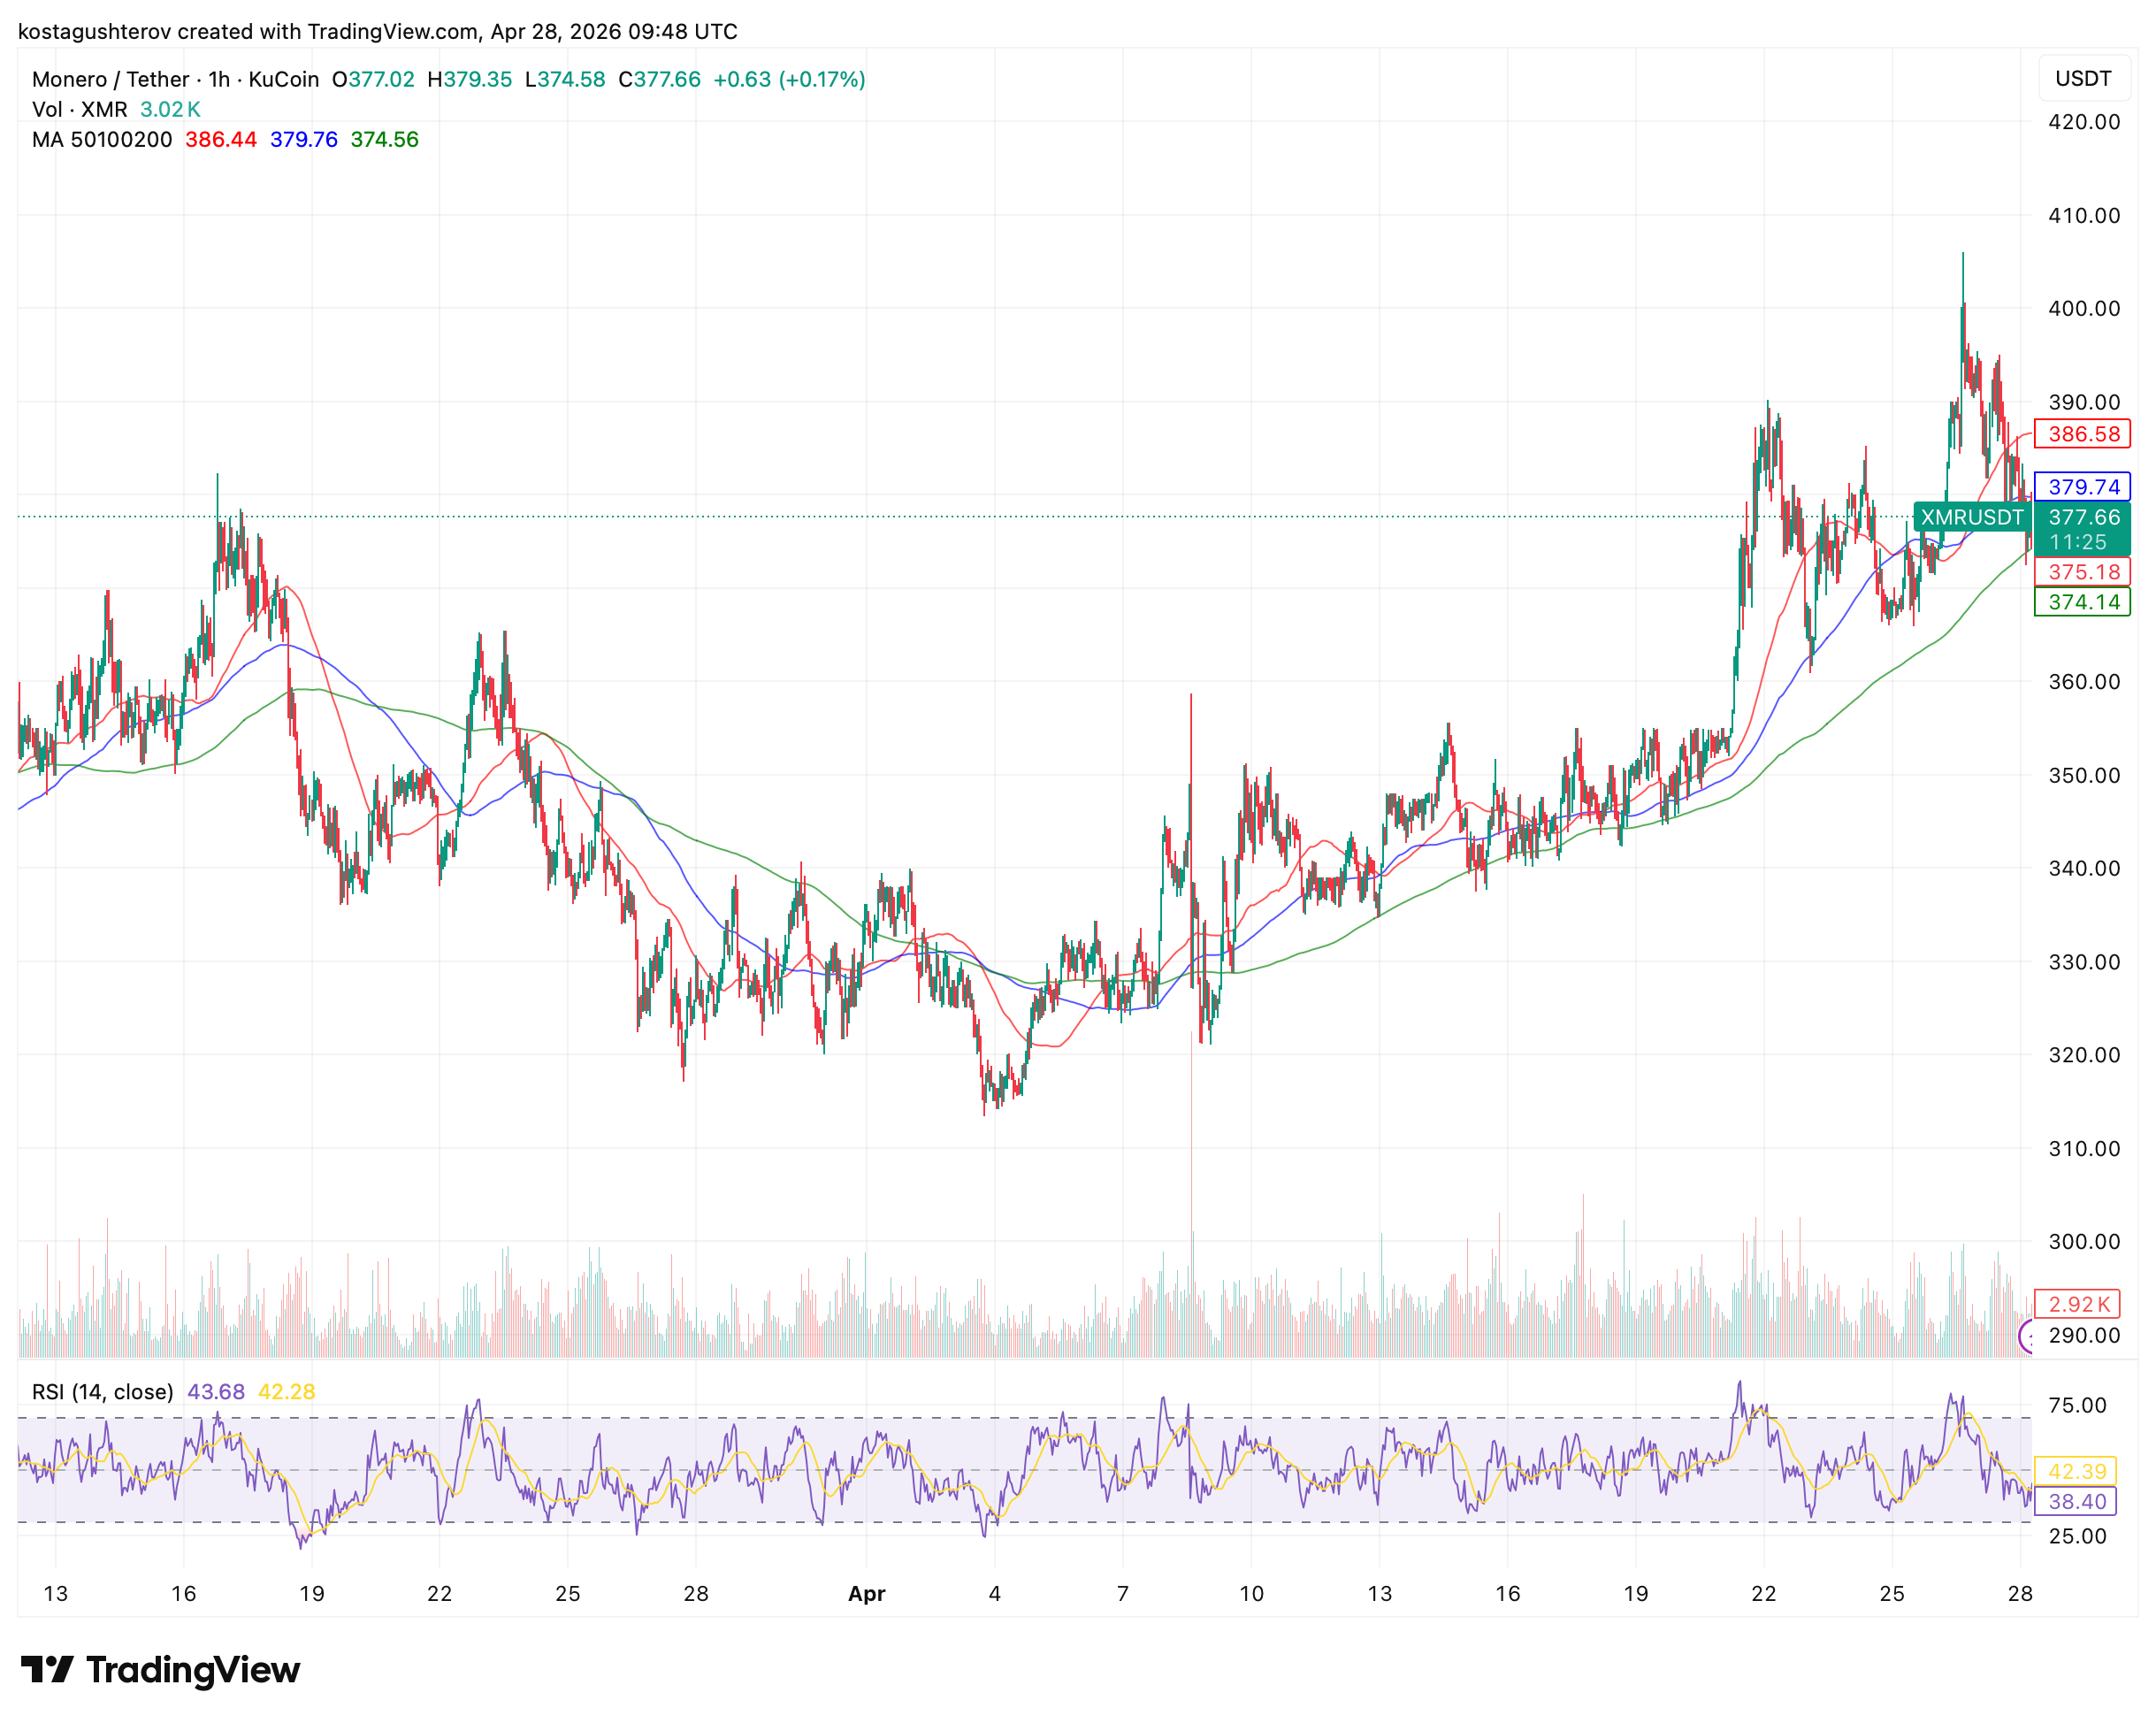
RSI at 42.28 is approaching oversold without reaching it. The prior oversold readings coincide with the April 7 low at $320 and the March washout at $290. Momentum is weakening at a price level 18% above the prior floor, not at the floor itself. A pullback that produces RSI near oversold at a higher price than the prior bottom is a higher low in momentum, which typically precedes the next directional leg rather than a continuation of the pullback.
The 200MA at $374.56 defines whether this pullback is a retest or a reversal. A daily close below it puts price back beneath the 200MA for the first time since the April 21 breakout.
Exhausted Spot Buyers
The bearish reading starts with the same CVD data but reaches a different conclusion. Spot taker buy dominance for 24 consecutive sessions is an exhausted signal, not a fresh one. Buyers sitting on 26% gains have no retail to sell into. The April 27 futures flip could mark peak optimism rather than structural alignment, the moment the last short covers and remaining buying pressure evaporates.
The more important risk is overhead supply. Every participant who bought XMR between $400 and $750 in January and February is underwater relative to their entry. As price recovers toward $400 and above, that cohort sees losses narrow and the incentive to exit at a smaller loss increases. This supply does not appear in any CVD chart because it has not moved yet. It becomes a structural factor the moment price re-enters the $400 to $450 range, and the retail frequency chart shows exactly how large that cohort was: the biggest concentration of Too Many Retail readings in the entire 12-month window.
Continuation Over Reversal
The weight of evidence as of April 28, 2026 favors continuation over reversal. The April rally was built on sustained spot accumulation with no retail overhang, and the 6.9% pullback from $405 is occurring above the 200MA with momentum making a higher low. The absence of retail is what makes the structure sound, not what makes it fragile.
The confirmation signal is a daily close above $386, the 50MA, with futures CVD remaining buy dominant for at least three consecutive sessions. That confirms the April 27 flip was structural alignment rather than a single short-cover event and sets up a retest of $405. The denial signal is a daily close below $374.56 accompanied by futures CVD returning to sell dominant, which would confirm the one-session alignment was a short cover and returns $340 to $355 as the base case. The 200MA resolves this within four trading days.