

HBAR has been fluctuating within a narrow range recently, and its short-term direction remains unclear. Latest data shows the token is trading at $0.0801, with a 24-hour trading range between $0.07801 and $0.0803, representing a daily change of approximately 0.1%, indicating a near-side trend.
Looking at a longer timeframe, HBAR remains weak. It has fallen 2.4% in the past 7 days, 6.7% in the past 30 days, and nearly 39.9% in the past year. This suggests that the current trend is more like a consolidation phase after a decline, rather than a clear recovery.
Short-term volatility continues to narrow
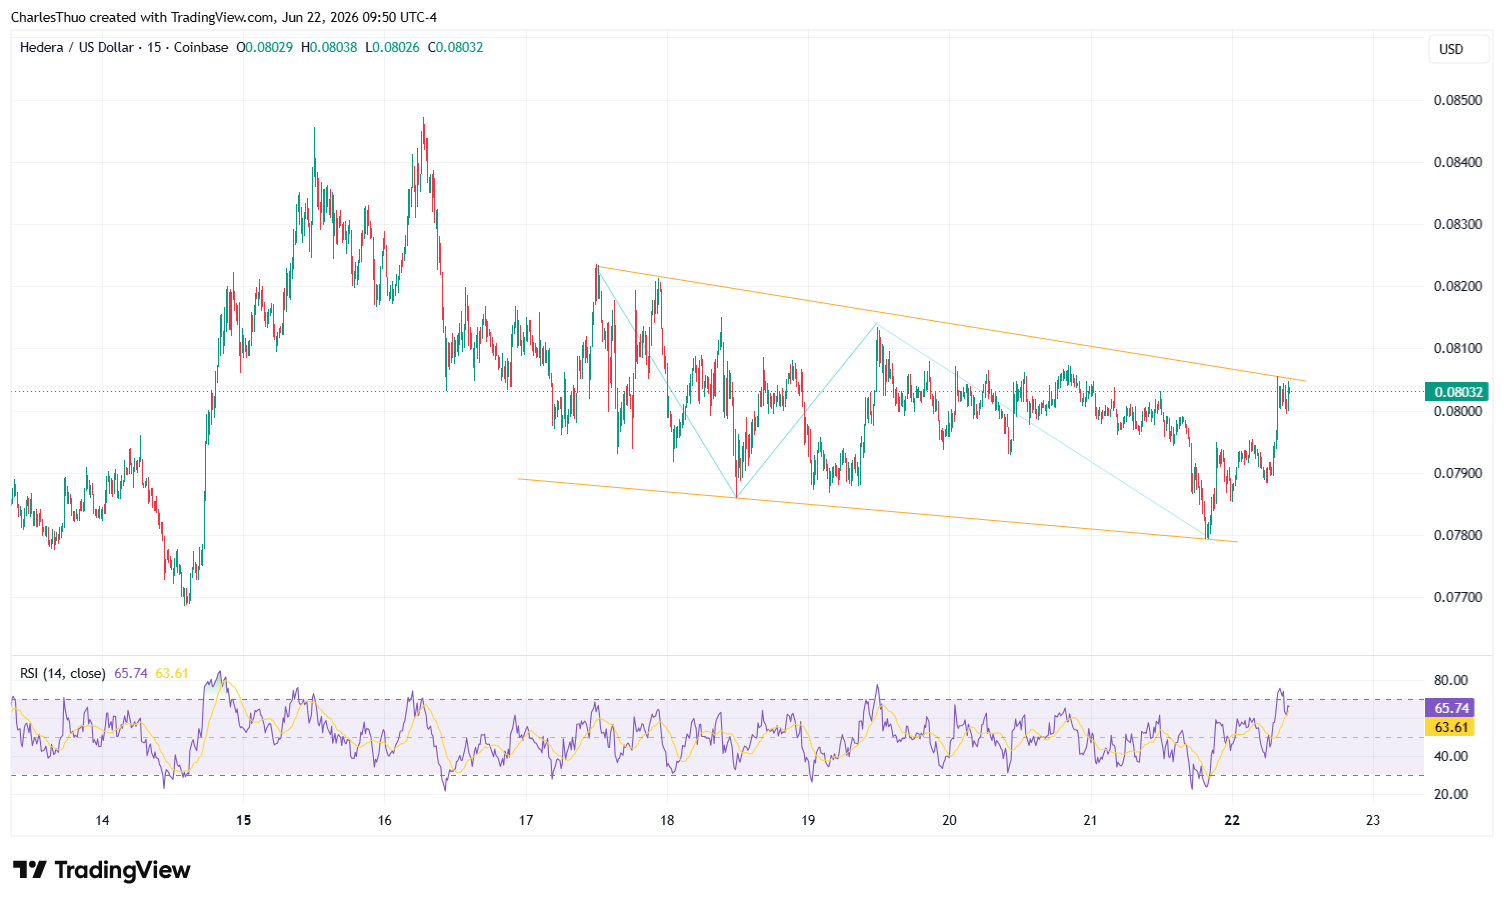
Currently, the area around $0.0780 continues to provide support, while the $0.0803 to $0.0810 range above has repeatedly limited any rebound. The price is fluctuating within this range, indicating a temporary balance between short-term buying and selling forces, and volatility is also decreasing.
This structure typically indicates that the market is awaiting a new directional move. Each small rebound encounters resistance at the top, while pullbacks to the bottom find support, causing prices to continuously converge into a narrower range.
The market is focusing on two key price levels.
Short-term charts show that HBAR has formed a converging structure on the 15-minute chart, with the lower edge roughly at $0.0780 and the upper edge between $0.0805 and $0.0815. The price is gradually approaching the end of this range, and the market is watching to see if a breakout will occur.
If the price rises above $0.0815, the short-term rebound potential may open up further, and the market's attention will shift to the $0.0830 and $0.0840 to $0.0850 range.
If the price falls below $0.0780, the current consolidation structure may be broken, and the price may retest lower liquidity areas, continuing the previous weak trend.
- Latest price: $0.0801
- 24-hour range: $0.07801 to $0.0803
- Key levels to watch: $0.0815 on the upside, $0.0780 on the downside.