

Stellar's token XLM remained in a narrow range on Tuesday, with the market still awaiting new price catalysts. Derivatives positions, funding rates, and on-chain selling pressure gave conflicting signals, indicating that traders have not yet reached a consensus on the next direction.
Based on current data, XLM remains near a key support level. If the bulls fail to break through the resistance above, short-term volatility may continue to increase.
Disagreement arises between long and short positions.
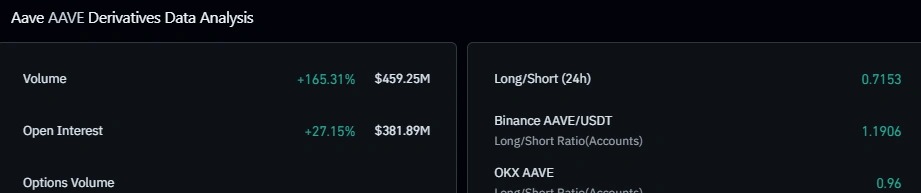
CoinGlass data shows that the long/short ratio for XLM is 0.81, meaning that short positions still outnumber long positions. This typically reflects a cautious overall attitude among derivatives traders.
However, the changes in funding rates were not entirely uniform. XLM's funding rate turned positive on Monday, rising to 0.0068%. This indicates that those holding long positions began paying fees, and bullish sentiment in the market has recovered somewhat.
Selling pressure has not eased significantly.
CryptoQuant data shows that selling pressure remains dominant in both the spot and derivatives markets. Large orders also indicate that some major investors remain cautious.
This means that even if short-term sentiment improves, XLM still needs to digest the persistent selling pressure if it wants to continue its upward trend.
Key price levels still need to be confirmed.
As of press time, XLM was trading at approximately $0.187, consolidating near a key support area. The price is currently below the 50-day exponential moving average at $0.189 but slightly above the 100-day exponential moving average at $0.187, indicating that buying pressure is still attempting to hold this level.
Momentum indicators are generally flat. The Relative Strength Index (RSI) is around 53, indicating weak but temporarily stable momentum; the MACD is slightly positive, closer to a consolidation phase than a clear one-sided trend.
On the upside resistance front, XLM will first face the 50-day moving average, followed by the 200-day moving average at approximately $0.196, and the 61.8% Fibonacci retracement level at approximately $0.200.
If selling pressure intensifies again, initial support lies around $0.187, followed by horizontal support at $0.177 and the 78.6% Fibonacci retracement level around $0.173. Further weakness could see longer-term support around $0.142.
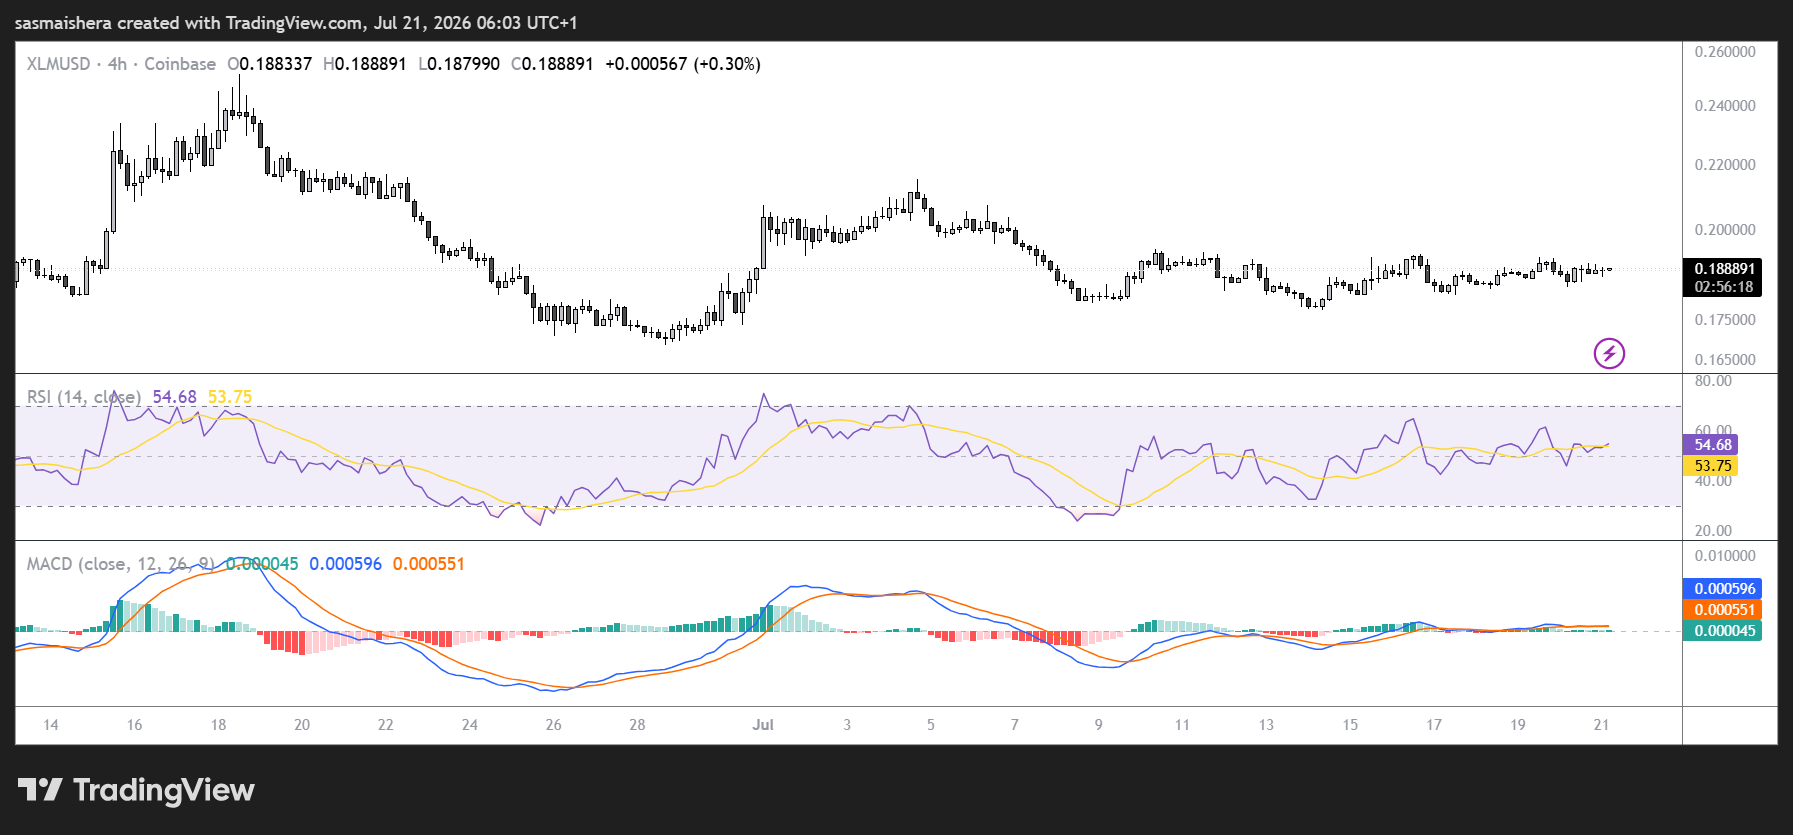
Overall, XLM is currently in a directional decision-making phase. Derivatives data and price indicators have not provided a unified signal, and short-term trends still depend on whether support levels hold and whether the upper resistance levels are effectively broken.