

The latest disclosure from TRON shows that the use of this public chain in stablecoin payments continues to expand, and on-chain activity remains high. Market attention is not only focused on the TRON network data itself, but also on whether these indicators continue to support TRX's strong performance.
Peer-to-peer transfers accounted for 93% of total transfers.
TRON stated that as of June 30, approximately 93% of stablecoin transactions on the network were peer-to-peer. This means that its use cases are more focused on transfers and payments, rather than just large-scale on-chain fund transfers.
Meanwhile, the percentage of native USDT transfers under $1,000 on TRON has increased from 43% to 52%. This change indicates that the use of small transactions is increasing, and network activity is no longer dominated by a few large addresses.
Structurally, the increase in the proportion of peer-to-peer and small-amount transfers usually means that stablecoins are penetrating deeper into daily payments, and also further strengthens TRON's position in the stablecoin settlement network.
Daily active users are close to Solana
On-chain data also shows that TRON has an average daily active user count of approximately 3.5 million, close to Solana's 3.8 million, and significantly higher than Ethereum's 532,000.
User base alone cannot determine token price, but the fact that TRON has maintained millions of active addresses amidst intensifying competition in Layer 1 demonstrates that it can still attract on-chain participants.
The significance of this type of data for the market is that if stablecoin transfers and active users grow in tandem, the network value of TRON is more likely to be seen as coming from real-world use, rather than just short-term trading activity.
Market focus on the $0.45 area
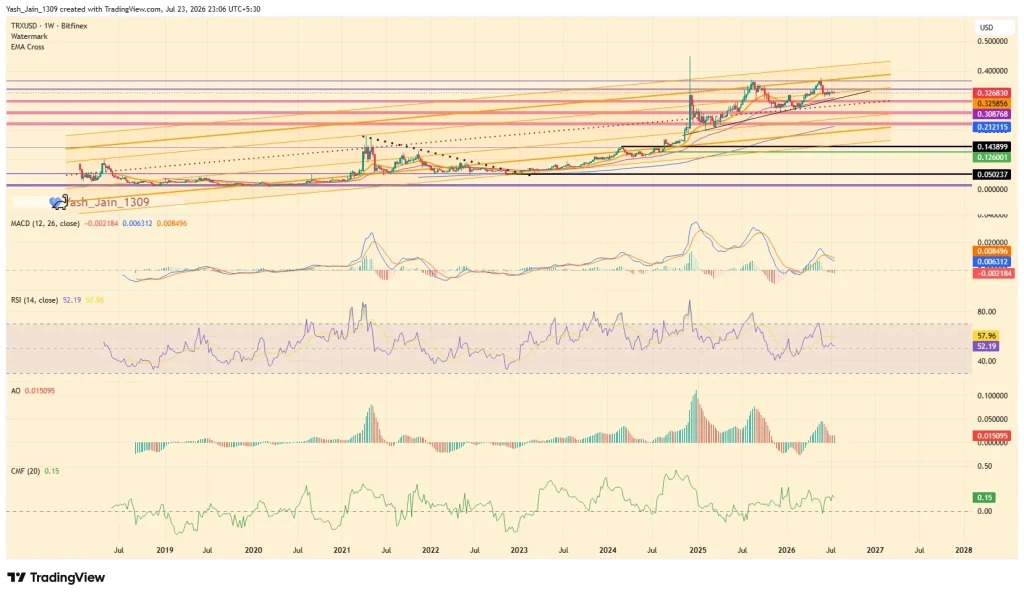
In terms of price performance, TRX remains in a strong medium- to long-term upward structure. The article mentions that since mid-2025, the money flow indicator has consistently remained above the zero line, and TRX has held the $0.2650 support level, even rising to $0.3745 in May 2026.
In addition, momentum indicators such as MACD and Awesome Oscillator remain above the zero line, and the TRX price continues to trade above the 20-week exponential moving average of approximately $0.3265.
If buying continues and network activity continues to improve, the market will next focus on whether TRX first tests $0.4265 and then further tests the $0.45 area. However, if the current upward structure is broken, this pace may slow down.