

After U.S. employment data surpassed expectations, the market re-priced the Federal Reserve's subsequent interest rate path. U.S. Treasury yields strengthened alongside the dollar, putting pressure on risk assets. Bitcoin once rose above $82,000, but then gave back some of its gains and fell back below $80,000, with a weakening short-term trend.
Rises sharply during the session before falling back
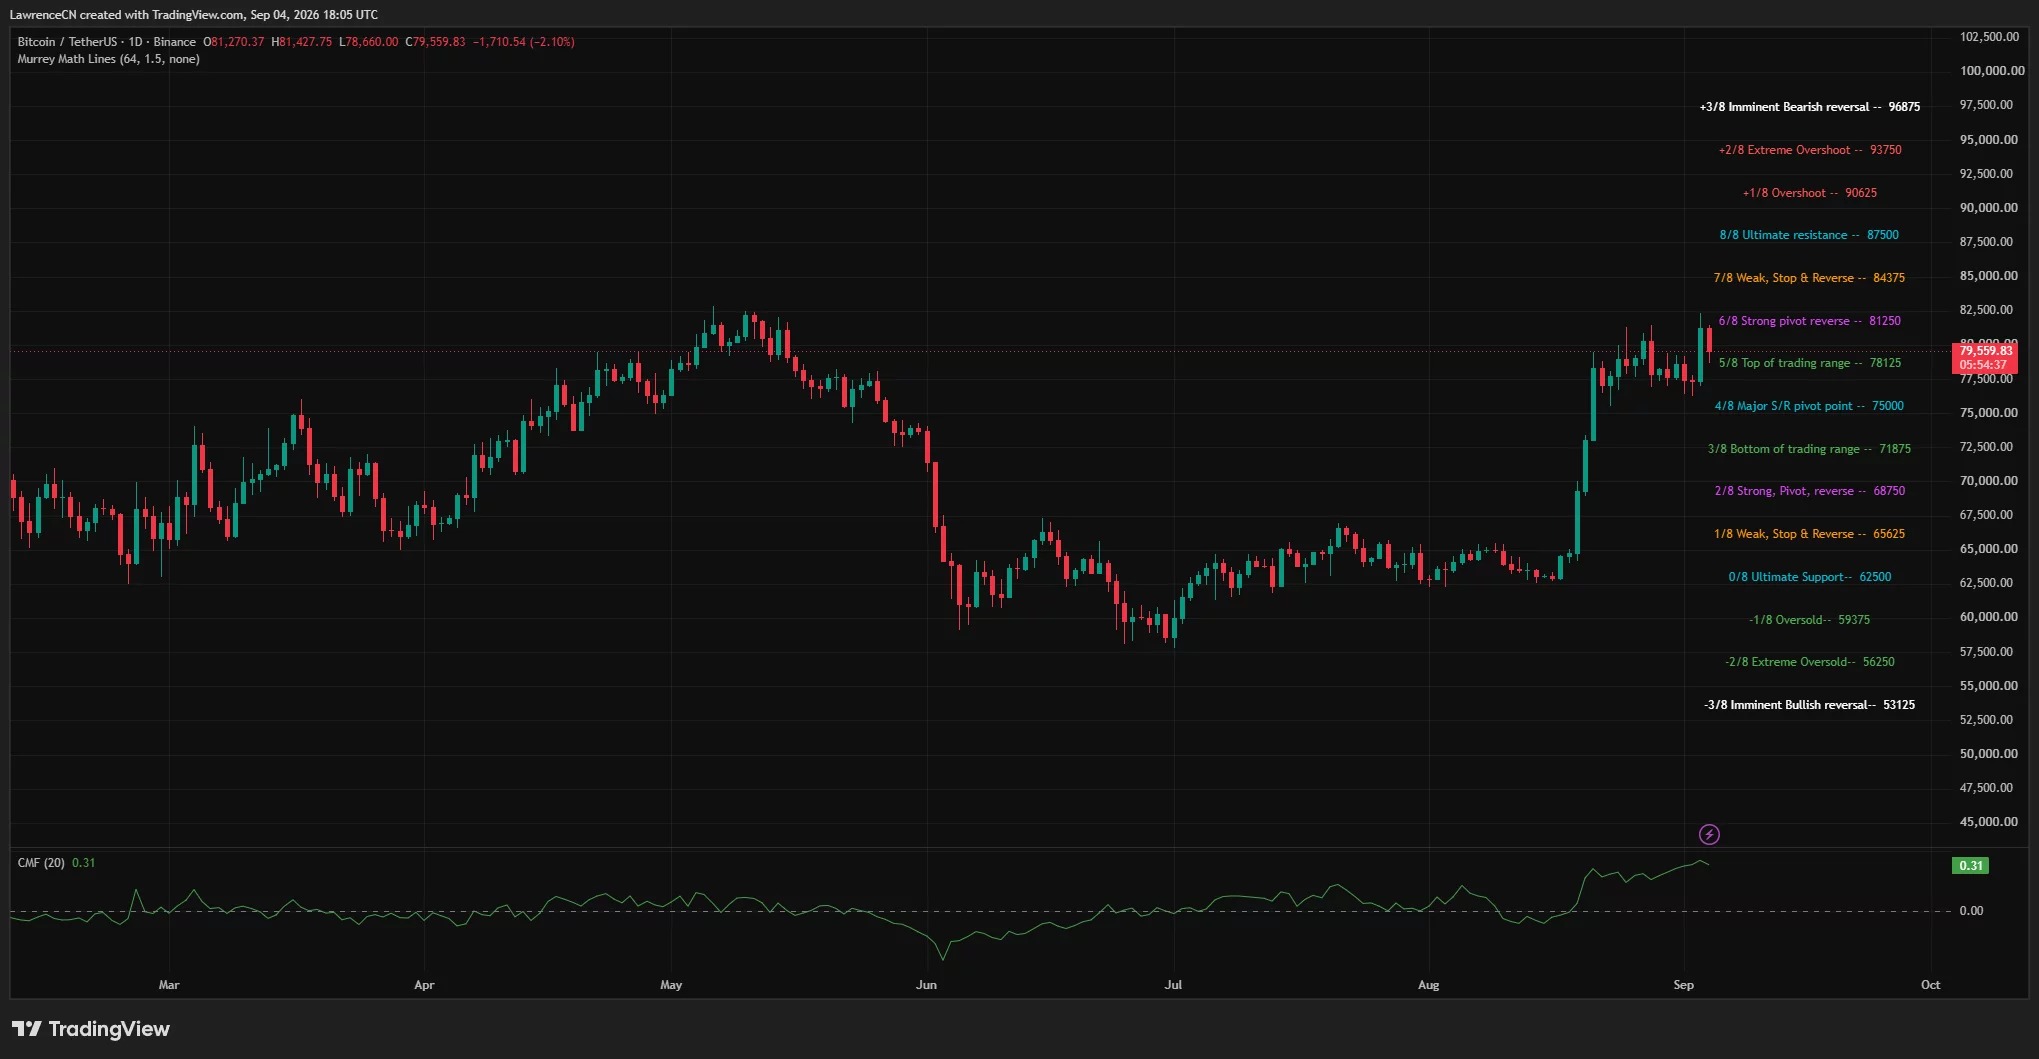
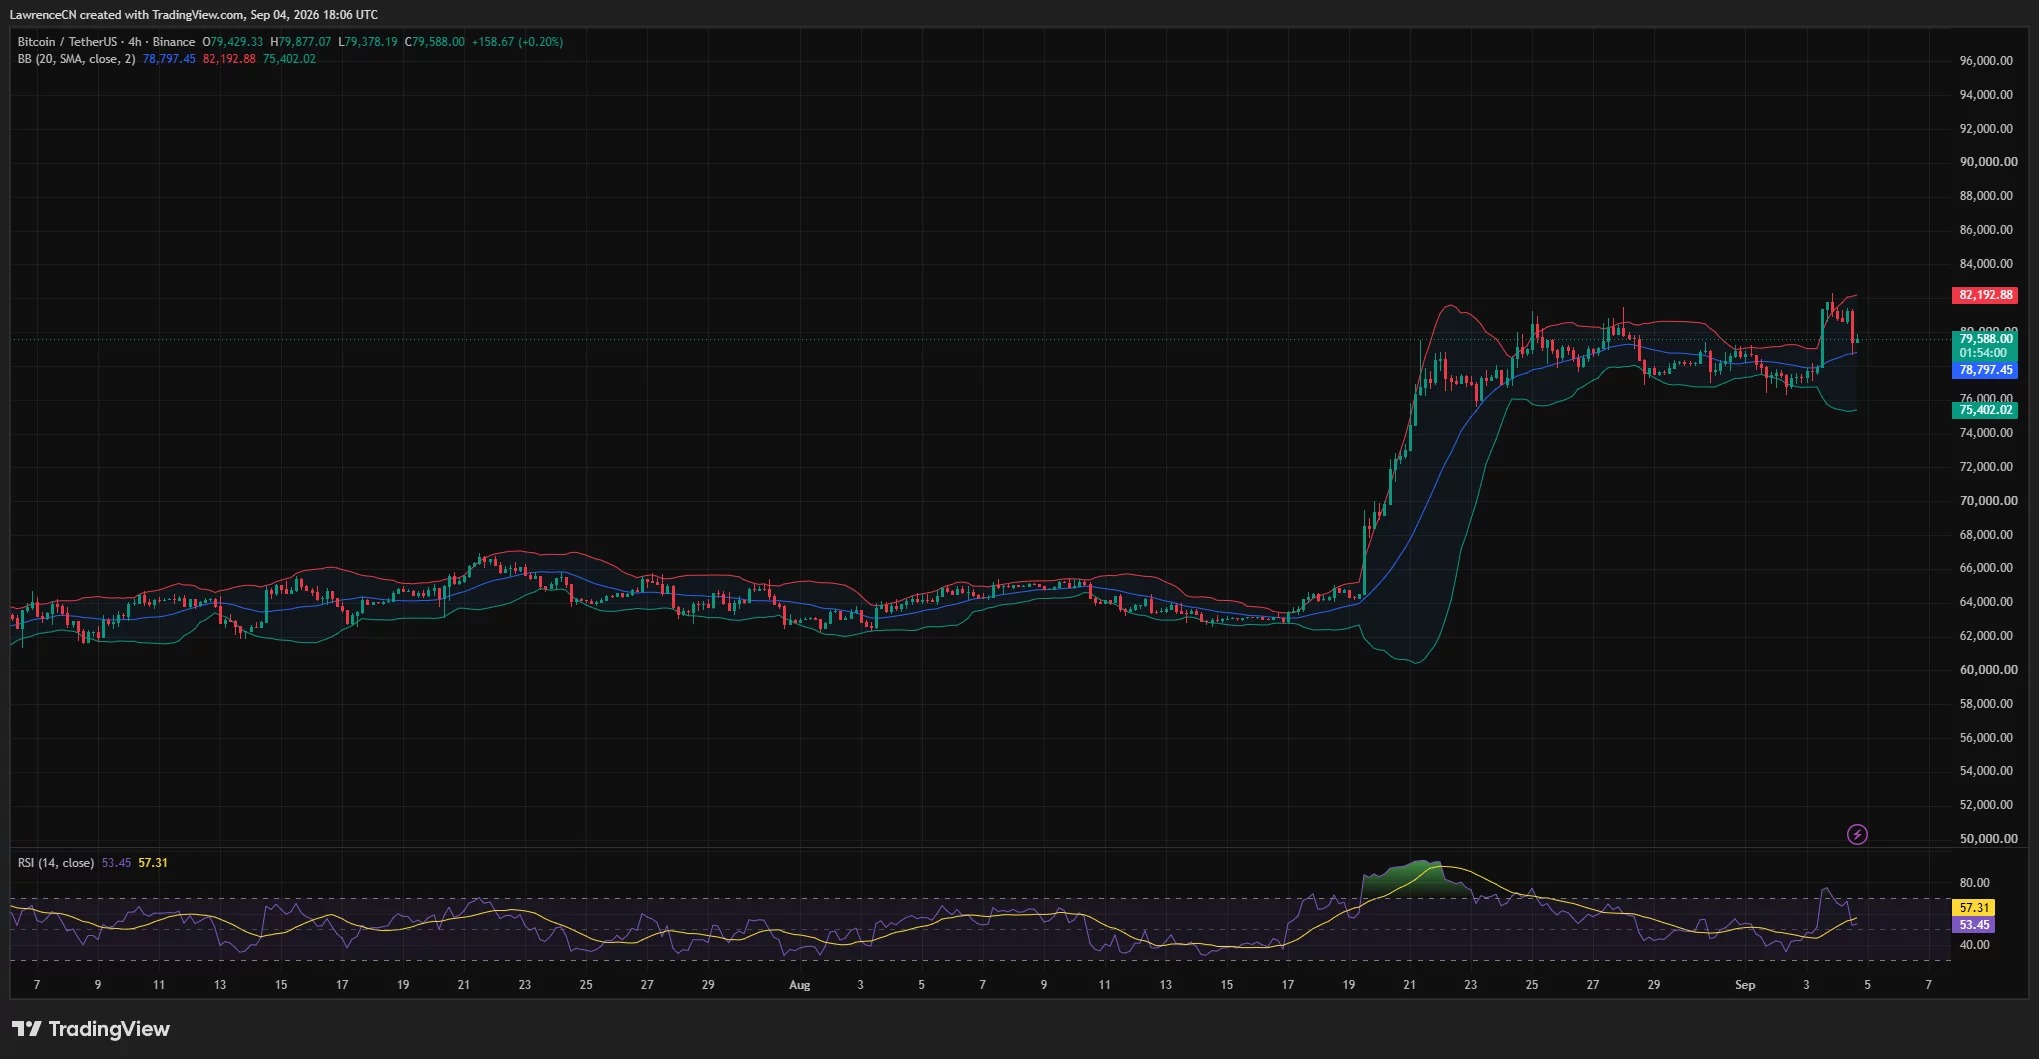
Data shows that Bitcoin reached a high of $82,281 during trading on September 4, before falling back to around $79,000, with a daily decline of about 2.1%. Prior to this, Bitcoin had rebounded from around $62,500 in mid-August, subsequently breaking through $75,000, and then consolidating in the range of $76,000 to $82,000.
Currently, the range of $78,800 to $79,300 is considered an important short-term support level. This area was previously a resistance zone. If future daily closes fall below this range, any subsequent breakout could be seen as a brief surge rather than the continuation of a new upward trend.
US data suppresses risk appetite
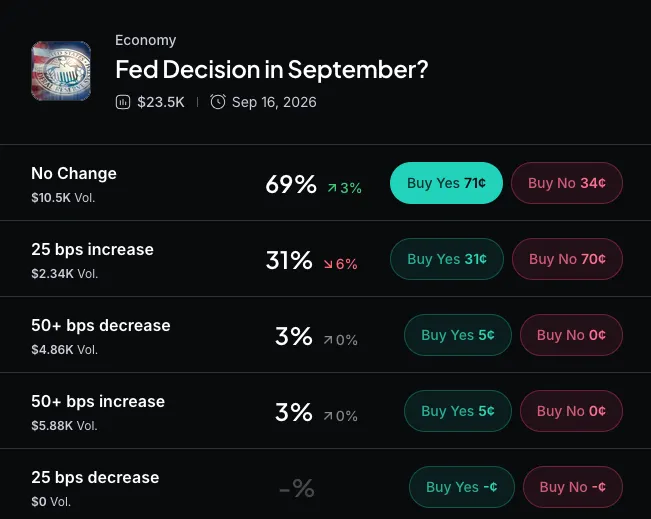
This decline coincided with the release of the latest employment data from the United States. Reports indicate that the number of non-farm jobs in the U.S. increased by 162,000 in August, exceeding market expectations, while the unemployment rate remained at 4.1%. Following the release of the data, markets raised their bets on a Fed interest rate hike in September, with the yield on 10-year U.S. Treasury bonds rising to around 4.77%, and the dollar also strengthened as a result.
An increase in yield typically enhances the attractiveness of fixed-income assets, thereby reducing the market demand for high-volatility assets. During the same period, capital flows in the U.S. stock market also tended to be defensive; money market funds continued to attract inflows, while U.S. equity funds experienced weekly net outflows.
$78,100 in support attracts attention
From a daily chart perspective, Bitcoin has failed to hold its ground near the key pivot point of $81,250. The market will now focus on the support level of $78,125. If this level is clearly broken through, the integer mark of $75,000 will once again come into view; if the trend continues to weaken, the next support level is roughly around $71,875.
However, the capital flow indicator Chaikin Money Flow is still above 0, indicating that the larger-scale buying orders have not completely withdrawn. On the 4-hour chart, Bitcoin is still slightly above the middle band of the Bollinger Bands at $78,797, but there is already a clear distance from the upper band at $82,193, suggesting that the short-term momentum has weakened compared to before.
After 4 hours, RSI has fallen back to 53.45, showing a significant cooling down from the previous overbought level. If the price can continue to hold near the middle band of the Bollinger Bands, the short-term trend can still remain neutral to slightly bullish; if it breaks down, the range of $76,000 to $77,000 may become the next support level.
There is still a concentrated area of liquidations above $80,000.
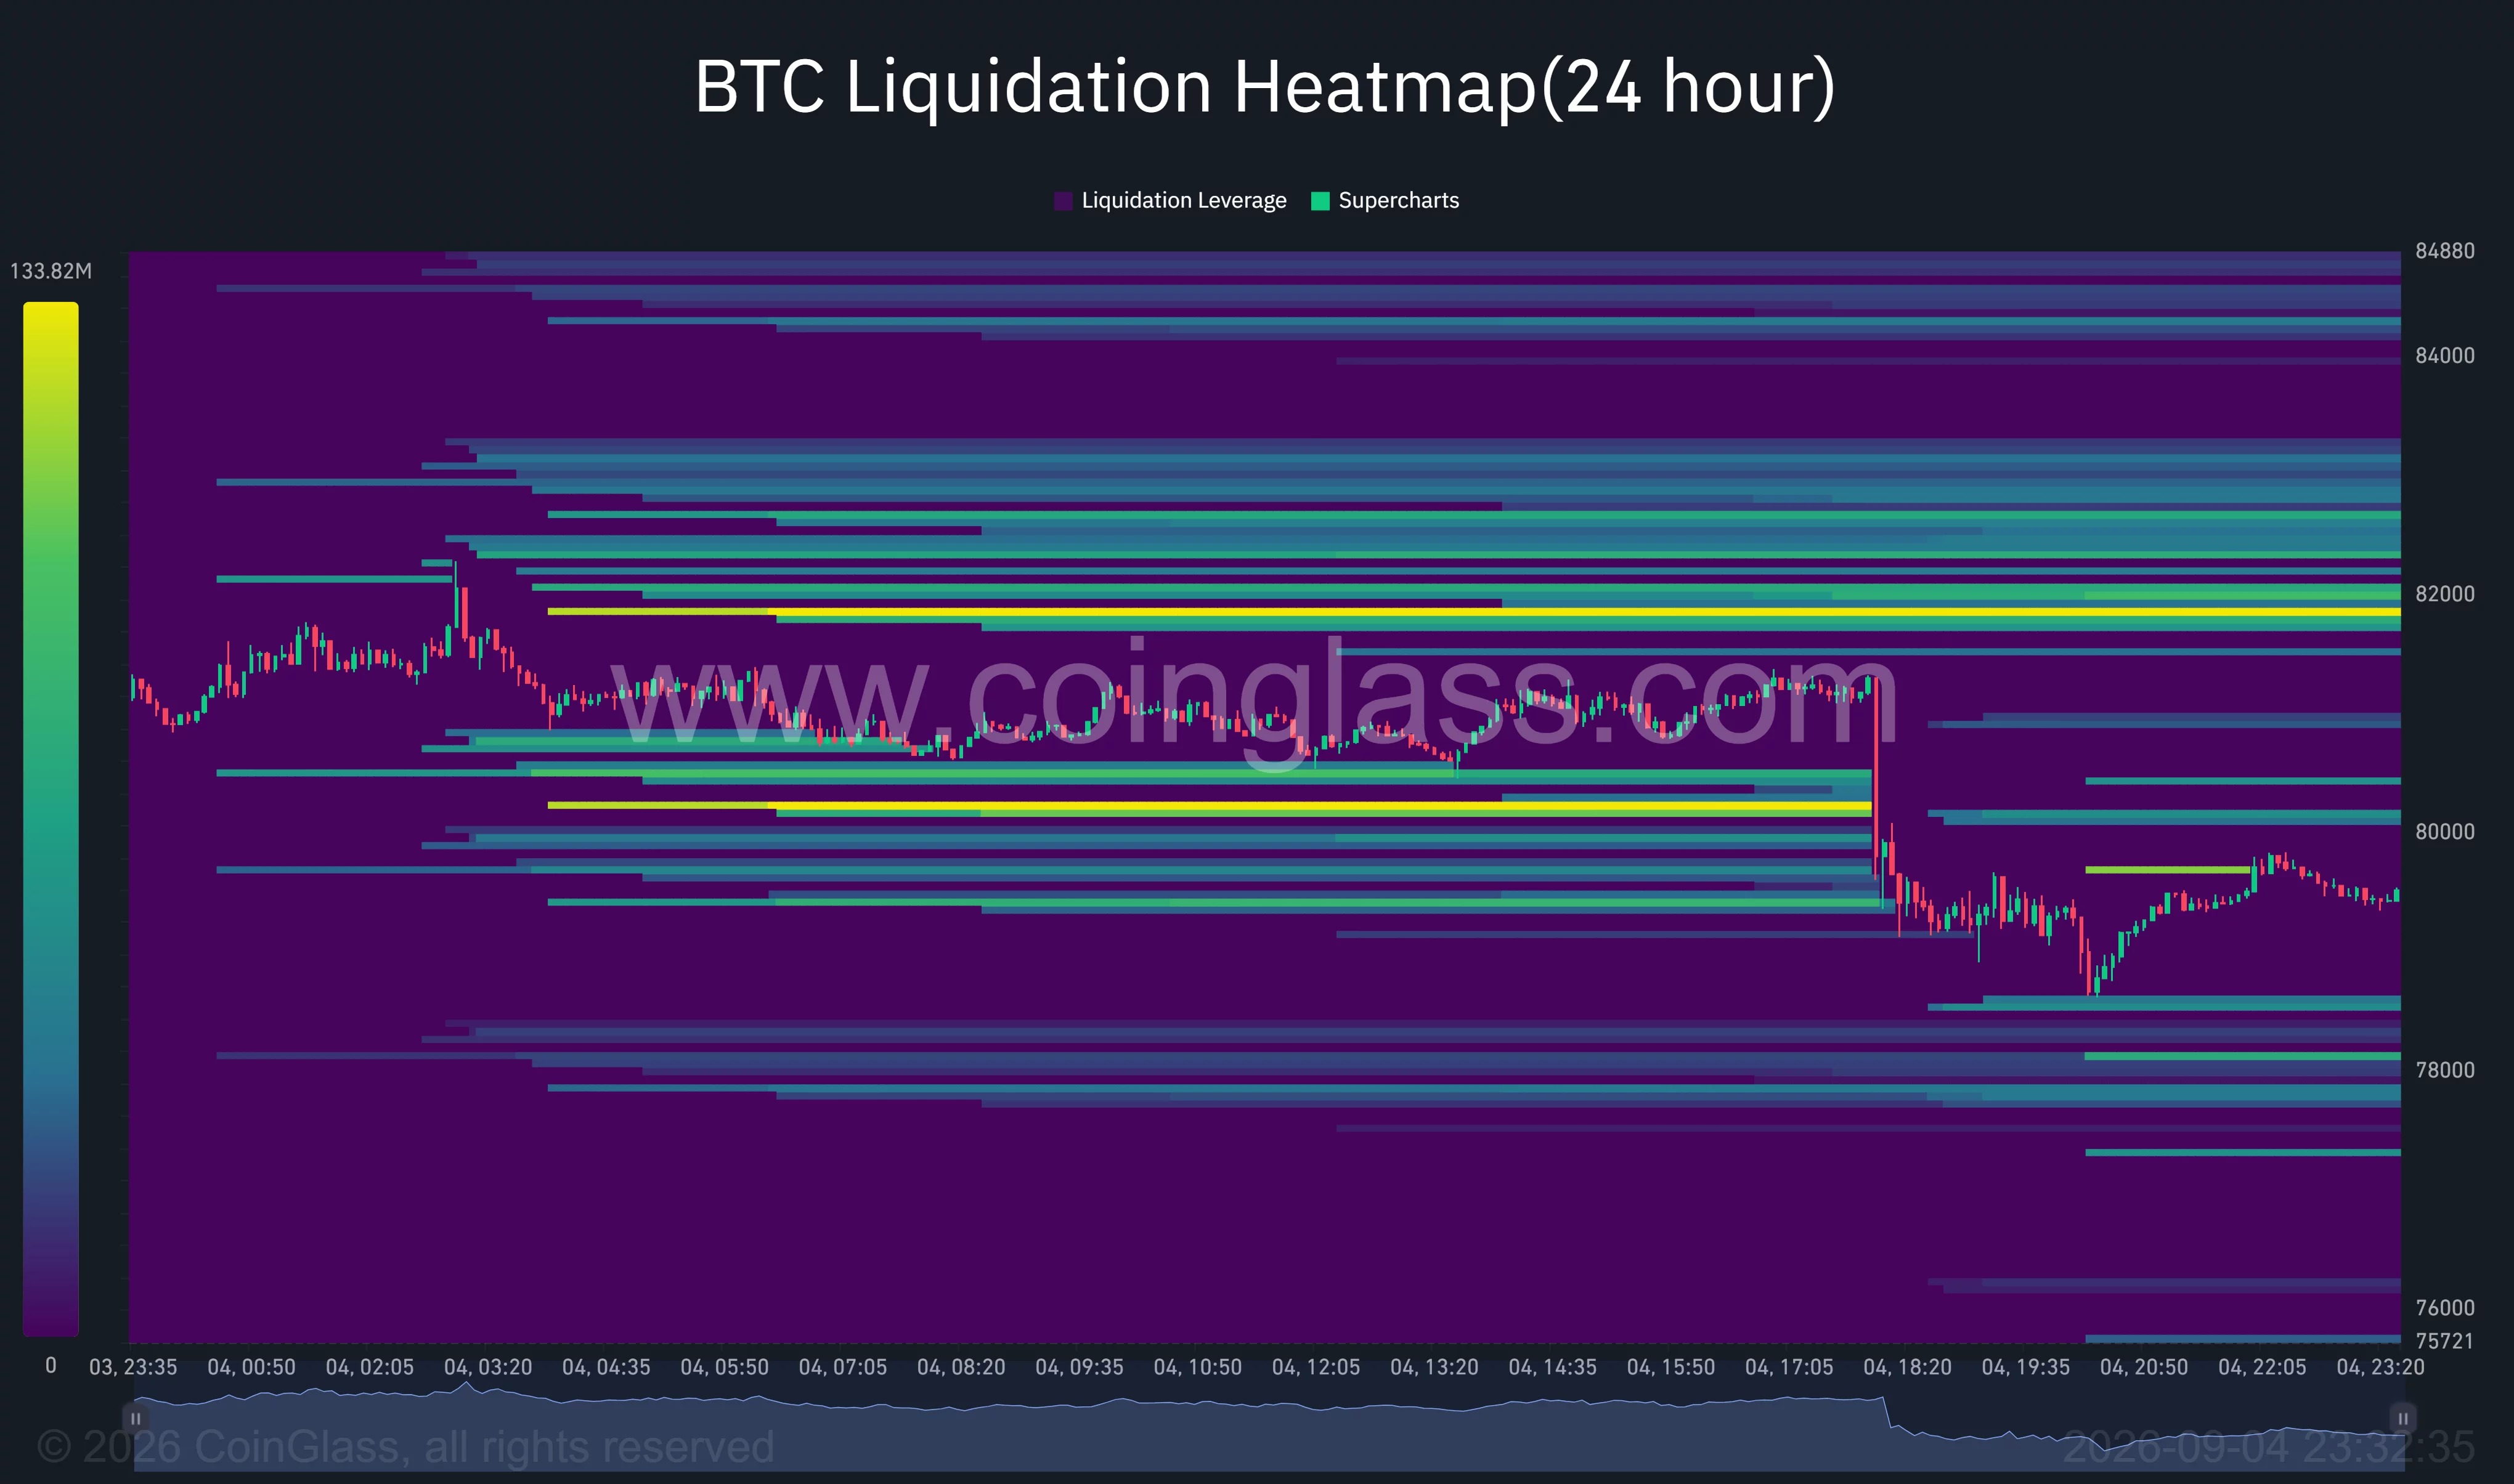
The 24-hour clearing heat map of CoinGlass shows that there are relatively dense leveraged positions above and below Bitcoin. The nearest liquidity above is concentrated between $80,000 and $80,300, while a more obvious clearing zone is located around $81,700 to $81,900. If the buying pressure pushes the price back above $80,000, these areas may become targets of short-term attention.
In the areas below, there is also a concentration of liquidity around $78,000, and there is an additional clearing zone between $77,500 and $77,800. Once the current support level is broken through, the volatility may further increase.
Traders on social media have stated that the range of $78,800 to $79,300 is a critical breakout and retest level that bulls need to hold onto. Some analysts also regard $79,000 as a key dividing line at present: if this level is maintained, the market could potentially test $82,000 again; if it is lost, prices might fall back into the $76,000 to $77,000 range.