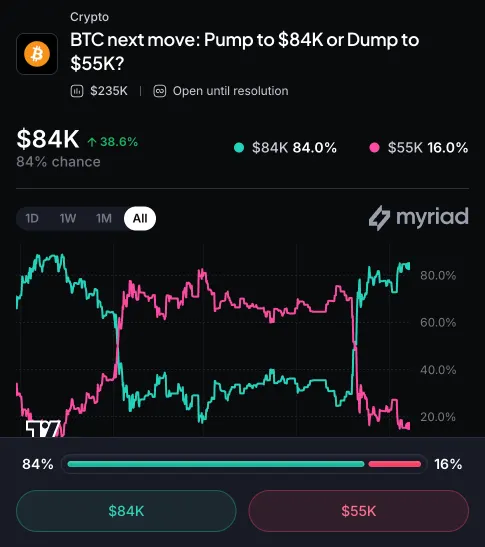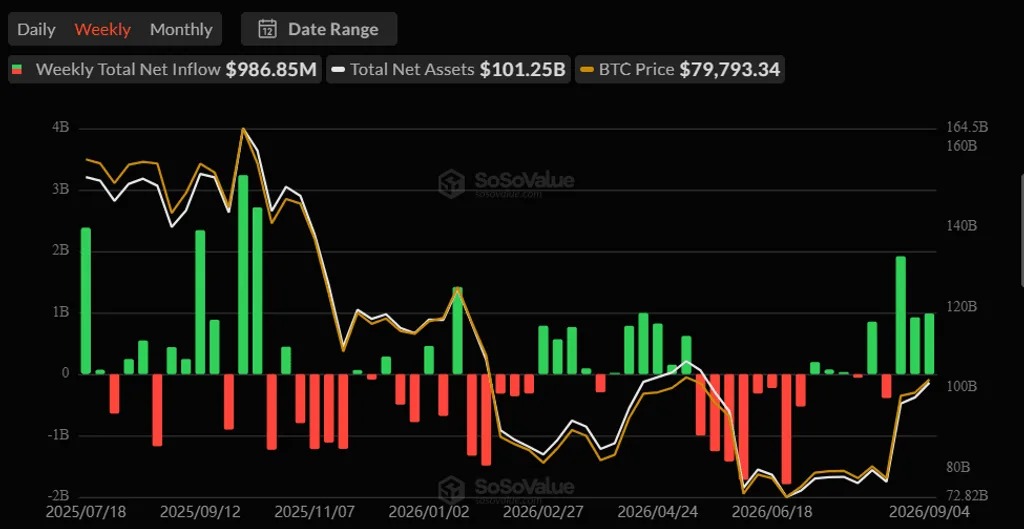






At the start of September, SOL rebounded strongly from $73 to above $103, reclaiming the 200-day moving average. Technically, the chart looks promising. However, the $150 mark coincides exactly with the 0.5 Fibonacci retracement level, a zone that has historically served as a major tend reversal point. As of press time, SOL is trading at $105.52, with a market cap of $61.276 billion. CoinMeta breaks down the technical and fundamental dimensions: Is $150 a reachable goal, or an insurmountable ceiling for September?
Table: Key Data Overview of Solana (SOL)
| Metric | Data |
|---|---|
| Current Price | ~$105 |
| Market Cap | ~$59.1 Billion |
| 24h DEX Trading Volume | ~$1.961 Billion |
| 30-day DEX Trading Volume | Over $58 Billion |
| SOL ETF Weekly Net Inflows | ~$4.9 Million |
| RWA Non-stablecoin Total Value | $4.23 Billion |
| RWA Holders | 398,644 |
| August Non-voting Transactions | 5.2 Billion |
Note: The above content is compiled and summarized by CoinMeta based on public market data. Please refer to the actual data if there are any discrepancies.
Technical Analysis of SOL
From a technical structure perspective, $150 is not an arbitrary target. The Fibonacci retracement analysis shows that the 0.5 level falls exactly at $150.08. In our view, $150 is a significant technical resistance node for the medium-term trend. A successful breakout would open upward space, while rejection could trigger a phased pullback.
The current technical landscape for SOL shows a mix of bullish and bearish factors.
On the positive side: SOL has reclaimed the $98 support level and is currently stabilizing around $103. All major moving averages (7-day, 20-day, 50-day, and 200-day) are positioned below the price, forming a typical bullish trend structure. Technical analysis on September 6 showed that SOL has broken out of its long-term consolidation structure, with bullish targets pointing towards $112 and even $129.49.
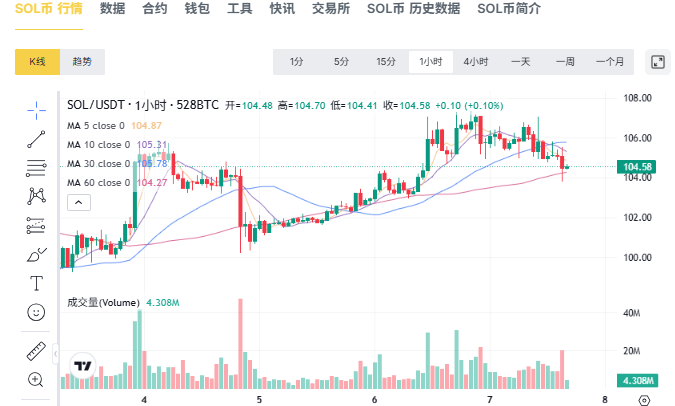
SOL K-line trend
However, we note that short-term signals are not entirely optimistic. The MACD histogram reads zero, indicating momentum has stalled. The RSI stands at 66.85, which, while not yet hitting the overbought threshold of 70, is entering a sensitive zone.
Can SOL break $150 in September? Our view is that SOL must first firmly hold above $107, and then break through the $123-$132 range, before it can mount a credible challenge towards $150.
Solana Fundamentals: On-Chain Boom Amidst Capital Concerns
Can SOL break $150 in September? We believe the strongest logic supporting an assault on $150 comes from the continuous expansion of on-chain fundamentals. Let's break this down.
RWA Value
In the RWA sector, Solana has established a leading position. As of September 5, the value of non-stablecoin RWA on Solana reached approximately $4.23 billion, a growth of about $530 million from the $3.7 billion reported by the Solana Foundation at the end of July. The number of holders increased to 398,600, a growth of 17.63% over the same period; the 30-day transfer volume reached $3.72 billion, with 2,691 registered RWA projects.
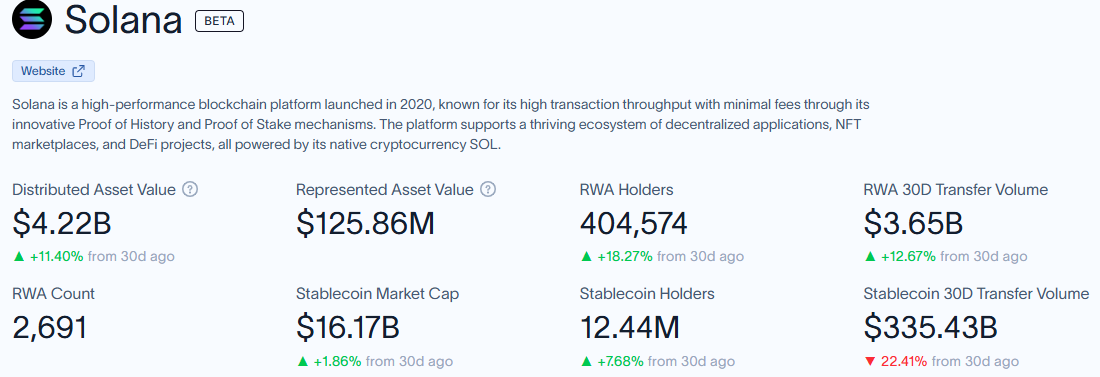
Solana RWA sector trading volume
Regarding net inflows, RWA Foundation data shows Solana's RWA net inflows over the past 30 days reached $348 million, with a 30-day growth rate of 11.13%, far surpassing Ethereum's modest 0.77% growth over the same period.
Network Activity
Network activity has also hit new highs. In August, Solana processed 5.2 billion non-voting transactions, setting a new all-time high and representing a 19% increase from the record set in July. During the week of August 24, Solana processed 1.32 billion transactions, surpassing the 800 million peak of the 2024-2025 Meme coin season. dApp fee revenue in August reached $143 million, an 81% increase from April's low.
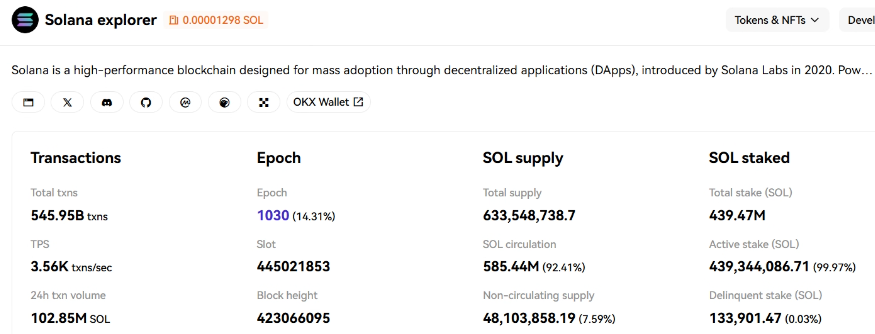
Solana blockchain transaction data
Approximately 9.5 million new wallet addresses were added weekly, and the number of whale wallets holding over 10,000 SOL increased by 52 in a single week.
SOL ETF Net Inflows
Regarding institutional flows, US spot SOL ETFs have recorded net inflows for 10 consecutive weeks, totaling $1.35 billion. Goldman Sachs has become the largest known institutional investor with direct exposure to Solana spot ETFs.
However, hidden concerns cannot be ignored. For the week ending September 4, Solana ETF weekly net inflows plunged by 97%, dropping from $1.427 million to just $49,000. Meanwhile, well-known crypto investment veteran Mark Yusko revealed he has sold approximately 90% of his SOL holdings. Furthermore, the rent reform launched on September 3 may release 3.08 million SOL into circulation.
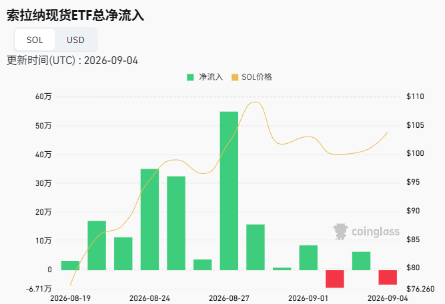
SOL ETF overview
Our assessment is: while long-term fundamentals remain positive, short-term capital flows are becoming highly volatile. The cliff-like drop in ETF inflows and profit-taking by whales constitute real resistance on the path to $150.
What Are the Odds of SOL Breaking $150 in September?
Based on the above technical and fundamental analysis, a $150 breakout for SOL in September is possible, but the challenges cannot be underestimated.
Bullish Scenario
If SOL can effectively break through the $107-$112 resistance zone accompanied by an increase in volume, it may sequentially challenge $123 and $132, eventually making a run at $150. The continued growth in on-chain activity, the deepening of the RWA narrative, and the long-term trend of ETF inflows are the underlying logic supporting this path.
Bearish Scenario
If SOL faces rejection in the $107-$112 region, it may retest the $102-$104 support area. Once the psychological $100 level is lost, the next key support falls in the $90-$95 range. The plunge in ETF inflows and whale selling could accelerate this correction process.

Common FAQ
Q1: What are the actual odds of SOL breaking $150 in September?
Answer: The probability is below 30%. $150 sits at the critical 0.5 Fibonacci retracement level, which has historically acted as strong resistance. SOL currently faces its first dense selling pressure zone in the $107-$112 range, compounded by a 97% plunge in ETF inflows and early whale distribution. There is a lack of sufficient momentum to break $150 in one go in the short term. A more realistic target range for September is $112-$129.
Q2: Why is the $107-$112 resistance zone so important?
Answer: Because this range is a dense trading band formed during SOL's decline from its historical high, accumulating a significant overhang of trapped positions. As the price returns to this zone, these trapped holders will tend to sell for breakeven, creating a natural barrier. Technical analysis indicates that without high-volume consolidation above this area, SOL will struggle to open upward space towards $150.
Q3: Does Solana's $4.2 billion on-chain RWA growth directly boost SOL's price?
Answer: It provides indirect support but not a direct boost. RWA asset growth reflects ecosystem vitality and real demand, which can strengthen market confidence in Solana's long-term value, thereby attracting medium-to-long-term allocation funds. However, in the short term, SOL's price is more heavily influenced by ETF flows, whale positioning, and macro sentiment. The RWA tailwind mainly acts as a supportive floor for the price.
Our Perspective
In our view, from the current level of $103, SOL would need to rally approximately 45% in a month to reach $150. The probability of a breakout above $150 in September is below 30%, which is quite difficult without a strong catalyst. A more realistic path is: in September, SOL will first test the $107-$112 breakout. If it holds, $129 is a more recent, reasonable target. The $150 breakout is more likely to occur in the fourth quarter, provided that on-chain growth continues, ETF capital flows return, and the macro environment is cooperative.
Disclaimer: Readers are strictly advised to comply with local laws and regulations. This article is compiled based on public market data for reference and educational purposes only, and does not constitute investment advice. Follow CoinMeta for the latest updates.