

On October 1st, the price of Ethereum remained above $2,700. At the same time, a wallet associated with Ethereum co-founder Joseph Lubin transferred 133,298 units of ETH, raising questions in the market about whether this large transfer would ultimately put downward pressure on the market.
It is alleged that this wallet, which is related to Joseph Lubin, transferred 133,298 ETH to a new address, which, at the time, was worth approximately $356 million; currently, there is no evidence indicating that these tokens have been sent to any exchanges.
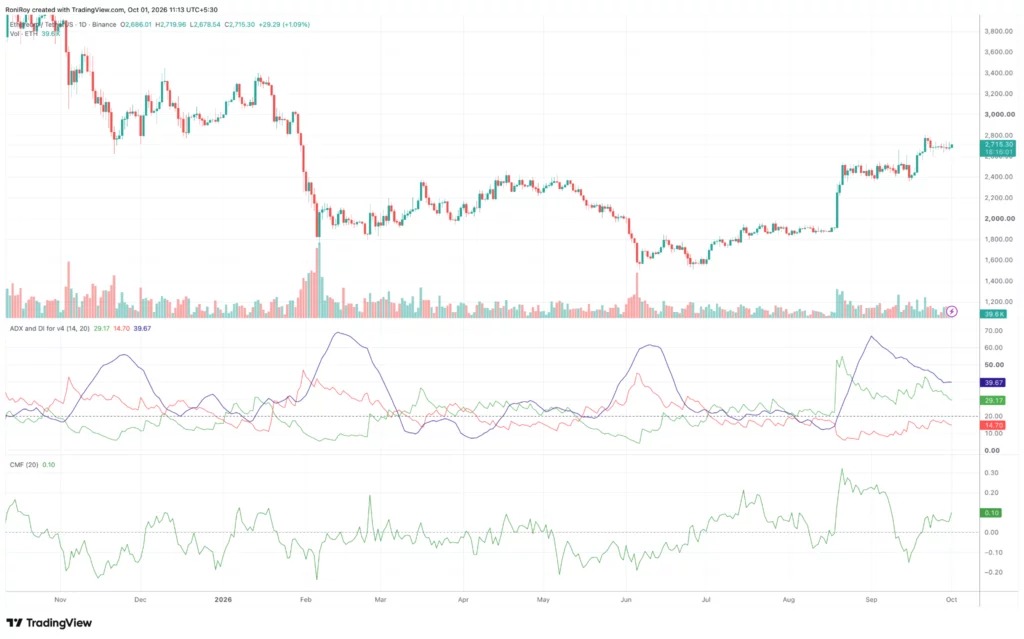
Although the strength of the trend has weakened, the daily DMI and the positive Chaikin Money Flow continue to show stronger buying pressure, with ETH still holding above $2700.
If the price breaks through $2,749 and $2,800, $2,900 and $3,000 may come into view; if it falls below $2,636, the short-term structure will weaken.
On-chain tracking tool Lookonchain reported that approximately 5 hours before issuing a warning, the wallet transferred 133,298 ETH to a new address, valued at about $356.2 million at that time.
This transaction did not send the tokens to any known centralized exchanges, which means that there is currently no evidence to suggest that these ETH were transferred with the intention of being sold immediately.
This distinction is very important for Ethereum's short-term price outlook. Transferring to exchanges usually increases the number of ETH that can be traded immediately, whereas transfers between private wallets do not necessarily bring about the same selling pressure.
However, the scale of this transaction has drawn attention to the receiving address. If these ETH funds subsequently flow to centralized exchanges, the market implications of the transfer could change.
As of press time, ETH has shown almost no immediate reaction, trading at around $2,715. The token is still above the $2,700 level, which has repeatedly become a key short-term battleground during recent rebounds.
Previously, after hitting around $2,800 on September 23 and then experiencing a pullback, ETH fell below $2,700 for a time. ETH reached a high of nearly $2,789 during trading, but then dropped to a low of $2,648, making the $2,800 area an important resistance level for buyers.
As of September 25th, funds have flowed in for a total of nearly $690 million over five consecutive trading days, providing the demand necessary for ETH to attempt a rebound. crypto.news previously reported that among these, BlackRock's ETHA accounted for $326.2 million of the weekly inflows, while Fidelity's FETH attracted $174.1 million.
The demand for ETF has offset some of the uncertainty in the market regarding ETH's inability to sustain a price above $2,800. Another analysis on Ethereum's price structure suggests that the range between $2,781 and $2,800 is currently the upward testing zone; if buyers can establish a sustained breakthrough, $3,000 could become the next target.
Pledge requirements also provide another source of supply absorption. As of September 28th, approximately 43.5 million ETH have been pledged, accounting for about 35.66% of the total supply; at the same time, around 1.61 million ETH are waiting to be pledged, while there are about 161,000 ETH waiting to be released from pledge.
This means that when observing Ethereum staking activities, the number of validators entering the queue is nearly ten times that of those exiting the queue. The staked ETH tokens are removed from the immediately available supply and used for the network, but the staking demand itself cannot determine the future price direction.
Can the price of Ethereum break through $2,750?
Despite the uncertainties brought about by large-scale wallet transfers, the overall Ethereum daily chart remains positive.
The directional movement index shows that the positive direction indicator is 29.17, which is significantly higher than the negative direction indicator of 14.70.
ADX is at 39.67, which is higher than the usual 25 level used to identify valid trends. Therefore, buyers still hold the advantage in terms of direction.
However, ADX has fallen from its September high. This decline indicates that the current trend is still relatively strong, but its intensity is weakening rather than continuing to accelerate.
The flow of funds provides another positive signal.
On the 20th, Chaikin Money Flow is currently at 0.10. After briefly falling below zero in September, it has returned to the positive range.
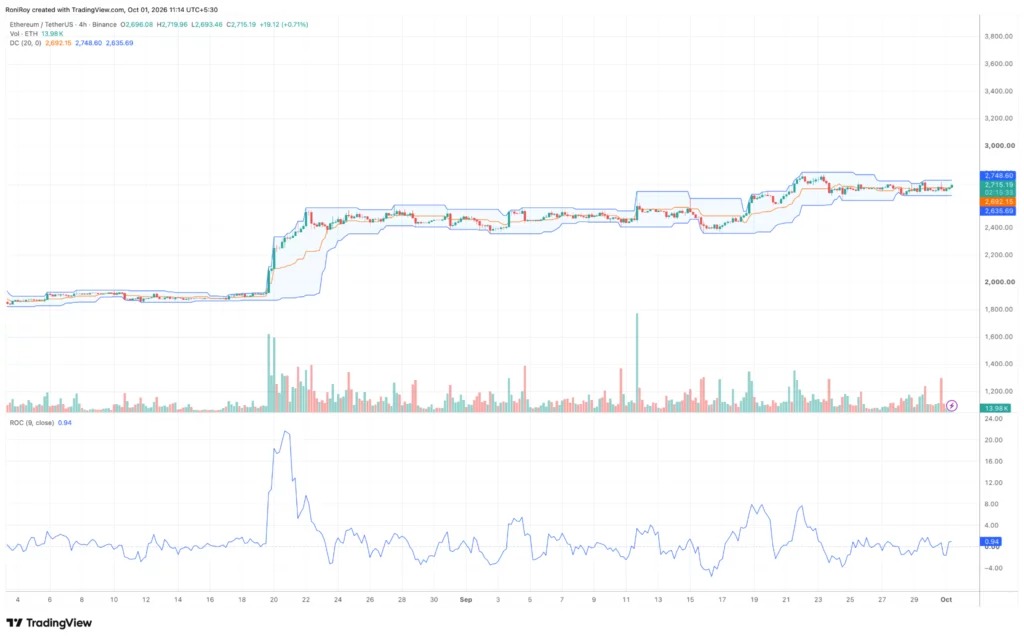
Meanwhile, on the 4-hour chart, Ethereum is operating within the 20-period Donchian Channel, with the upper band at $2748.60, the middle band at $2692.15, and the lower band at $2635.69.
Therefore, the price is currently in the upper region of the channel, but a breakout has not yet been confirmed.
The 9-period volatility rate is 0.94, indicating that the short-term momentum is in a positive range. However, this reading is still modest and has not yet shown signs of acceleration sufficient to confirm a stronger breakout.
If the closing price in 4 hours exceeds around $2,749, and is accompanied by an expansion of ROC, it could once again bring the recent resistance level of $2,800 to the forefront.
Ethereum has previously encountered resistance near this level on several occasions. The last time it approached $2,800, it saw a decline that pushed ETH down to $2,648 before buyers regained control.
If it can continuously break through $2,800, the price may further rise to $2,900, followed by the psychological barrier of $3,000. The latter has become an important target in recent Ethereum price analyses, but ETH first needs to overcome several resistance levels that have suppressed rebounds.
If it is not possible to break through the upper track of the Tangqian channel, $2,692 will become the first level of support to watch out for.
More importantly, the short-term support level is around $2,636, which is close to the lower track of the channel and also near the level that buyers managed to hold during the pullback on September 23rd.
If it falls below $2,636, and at the same time ROC further enters the negative range, the short-term structure will weaken. If the daily line CMF falls below the zero axis, and the negative indicators begin to narrow the gap with + DI, then this can be further confirmed.
For now, Ethereum's technical structure does not indicate that the transfer of 133,298 ETH is turning into selling pressure. The price of ETH remains above $2,700, with a positive daily capital flow, indicating that buyers still hold the advantage in direction. However, the range from $2,749 to $2,800 remains a key resistance level before reaching $2,900 and $3,000.