

Key points:
- Bitcoin fell below $86,000 on Tuesday, after having risen for three consecutive weeks, with a cumulative rebound of over 12%.
- US spot Bitcoin ETF recorded a capital outflow of $90 million last week, following a large-scale inflow the week prior.
- Resistance levels are at $87,599 and near $90,000, while $85,000 remains immediate support.
Bitcoin remained below $86,000 on Monday and Tuesday, continuing a rebound of over 12% since mid-September. ETF demand, as well as constantly changing interest rate expectations, supported market sentiment.
These cryptocurrencies have recorded weekly gains for three consecutive weeks and are now approaching a resistance level that may determine whether buyers can extend the upward trend to $90,000.
From the daily and weekly charts, its technical structure still appears strong. However, some of the daily momentum indicators have begun to soften, indicating that the market is more likely to consolidate near recent highs rather than continue to move upwards in a single direction.
Maintaining the nearby support level of $85,000 will help to sustain this bullish structure; if it falls below that level, there is an increased possibility of a more significant pullback.
According to SoSoValue data, US spot Bitcoin ETF recorded a net inflow of $241.09 million last week.
This means that funds have been flowing in for the third consecutive week, indicating that while the price of Bitcoin has rebounded, the demand for these products continues to persist.
However, the start of this week was not optimistic, with related funds experiencing a net outflow of 90 million US dollars on that day.
Sustained capital inflows provide support, but they do not guarantee that prices will continue to rise. The significance of this will depend on whether the buying pressure persists and its strength compared to other selling pressures in the market.
If inflows accelerate, it will further strengthen the demand side as Bitcoin approaches the upper resistance level; conversely, if capital flows weaken, any rebound will rely more on other buying forces.
For now, the ETF event remains one of the factors supporting the recent upward trend.
Weaker non-farm data reduces expectations for a rate hike in October
After last Friday's U.S. employment report fell short of expectations, investors also lowered their forecasts for the Federal Reserve to raise interest rates again.
Data from the U.S. Bureau of Labor Statistics shows that non-farm employment increased by 29,000 in September, lower than the market's expectation of 90,000. The increase in August was also revised down from 162,000 to 133,000.
After the release of this report, CME FedWatch showed that the market's probability of a rate hike in October dropped to 18.3% on Monday, compared to around 70% the previous week.
A decline in interest rate hike expectations usually benefits risk assets, as it alleviates market concerns about further tightening of financial conditions.
However, a lower probability of interest rate hikes does not necessarily mean that policy will turn more accommodative; this is merely market pricing, and it may still change as more economic data becomes available.
Bitcoin Technology Outlook: The weekly resistance level is between BTC and $90,000
From the weekly chart perspective, Bitcoin first faces a resistance level of $87,599. This position represents the 50% retracement level between the low of $49,000 in August 2024 and the historical high of $126,199 in October 2025.
If it can effectively close above that level, the market will further focus on the 100-week simple moving average of around $89,832, followed by the psychological barrier of $90,000.
The weekly momentum still supports this round of rebound. The Relative Strength Index is around 62 and is still on the rise, while MACD indicates an expansion in the positive bar chart.
If the resistance level is held and a broader pullback occurs, the downward reference levels mentioned in the text include the Fibonacci level of $78,490, as well as the 50-day simple moving average near $77,201.
The daily chart shows that Bitcoin is above the 50-day, 100-day, and 200-day exponential moving averages, reinforcing the bullish trend in the short term.
The daily line RSI is around 67, indicating strong momentum, but it is still slightly below the traditional overbought range. At the same time, the MACD bar chart has fallen back to near zero, suggesting that the upward momentum is slowing down.
The immediate support level is at $85,000. If the daily close falls below this level, it will weaken the consolidation structure and expose the market to the 50-day EMA around $79,189.
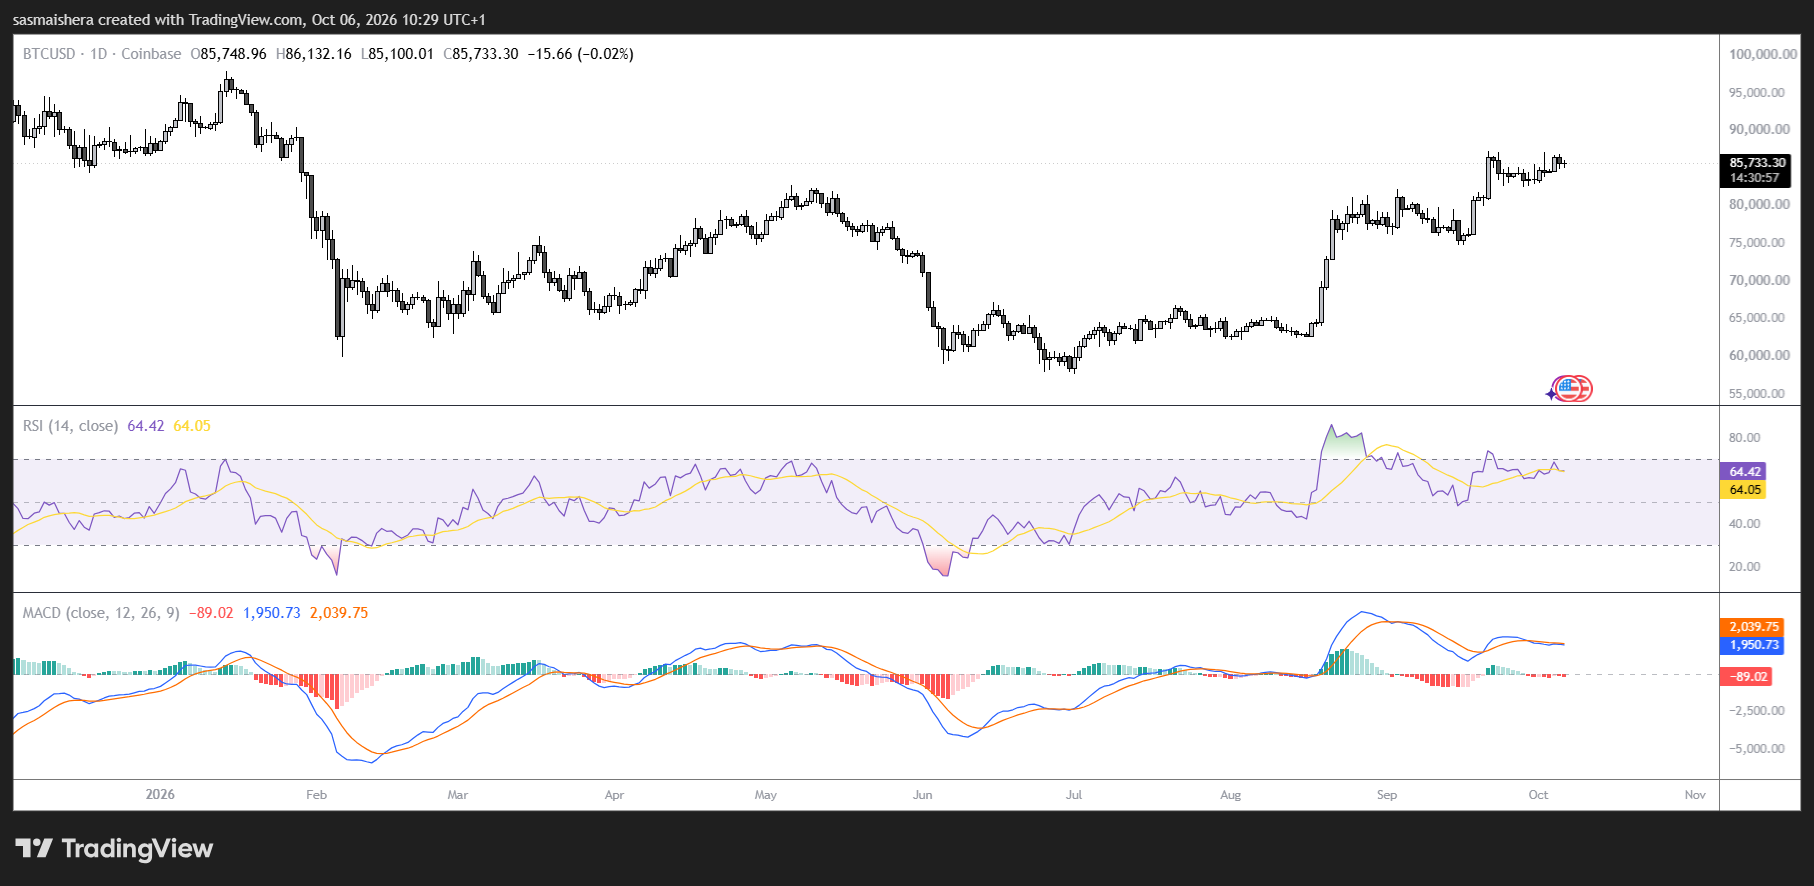
Further down, the 100-day EMA level is at $75,367, and the 200-day EMA level is close to $74,994, forming a deeper support area. Further horizontal support levels are at $66,500 and $62,300 respectively.
The rebound of Bitcoin is still in place, but if it can break through $87,599, it will more strongly confirm that buyers have the capacity to push the market towards $90,000.