Bitcoin rebounded today. In the previous week, traders replaced the " Uptober " emoji pack with the " spooky szn " emoji pack, as BTC had already cut in half of the September gains.
Earlier on Tuesday, the price of Bitcoin fell to $80,953.41, continuing the selling pressure from Monday, before rebounding to $83,591.79, representing a 2.24% increase for the day.
Bitcoin ETF saw a net outflow of $386.3 million in October, and such capital outflows will force funds to sell the Bitcoin they actually hold. The Consumer Price Index ( CPI ) report released on Wednesday is the next test, with the market expecting the annual inflation rate to rise from 3.4% to 3.6%; if the data is even worse, it could boost bets on interest rate hikes and put pressure on Bitcoin. The Federal Reserve will hold a meeting from October 27th to 28th.
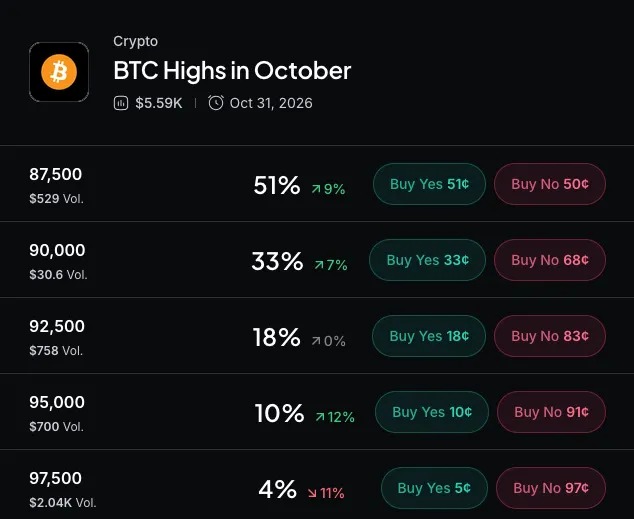
On the prediction market Myriad developed by Decrypt's parent company Dastan, traders believe that the probability of Bitcoin falling to $80,000 this month is 54%, which is lower than 56% on Monday. The market's probability of reaching a high of $87,500 in October BTC is 45%. Overall, although the decline is not significant, market sentiment has improved today.
Bitcoin Price: Bulls Hold the Golden Zone
Today's low was about $588 higher than $80,365.12, which was the swing low at the beginning of the rebound. Higher lows are a signal that traders hope to see in an uptrend. Bitcoin has also re-entered the Fibonacci "golden zone" between $81,847.57 and $82,305.50; pullbacks during an uptrend often attract buying in this range.
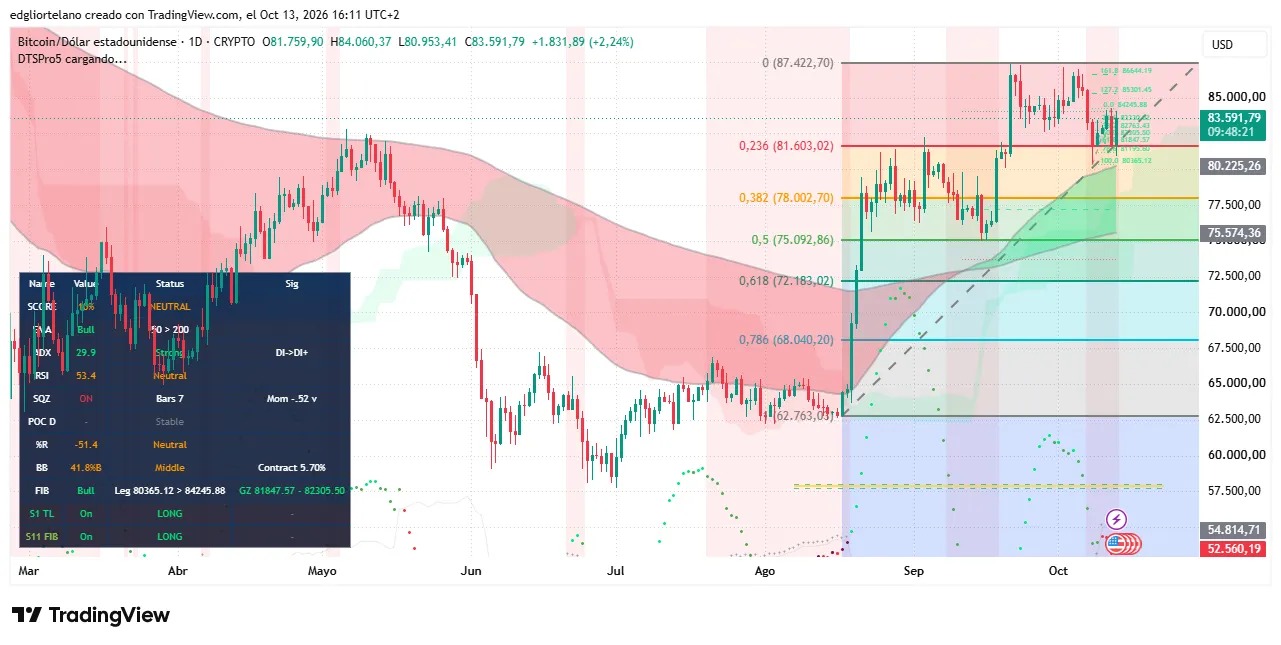
The Relative Strength Index (RSI, RSI) is a momentum indicator ranging from 0 to 100, and it currently stands at 53.4, which is slightly above the 50-line that separates bullish from bearish momentum. The RSI has been in a bullish trend for 7 consecutive trading days, indicating that volatility is compressed like a coiled spring, and its reading of -0.52 is slightly bearish.
If the daily close exceeds $84,245.88, it will open at $86,644.19, followed by a high of $87,422.70, which is only about $77 short of the target of $87,500 given by Myriad. If the level of $81,603.02 is lost, then the upper trend line of the daily chart will come into view, with a position slightly above $80,000; if the close falls below that level, there is a possibility of a decline to $77,500.
Before the release on Wednesday CPI, the current compression trend indicates that the market is more likely to be building momentum rather than making a directional choice. Oil prices, news related to Iran, U.S. Treasury yields, and daily ETF capital flows remain catalysts that need attention in the short term.
Disclaimer
The views expressed by the author are for informational purposes only and do not constitute financial, investment, or other advice.