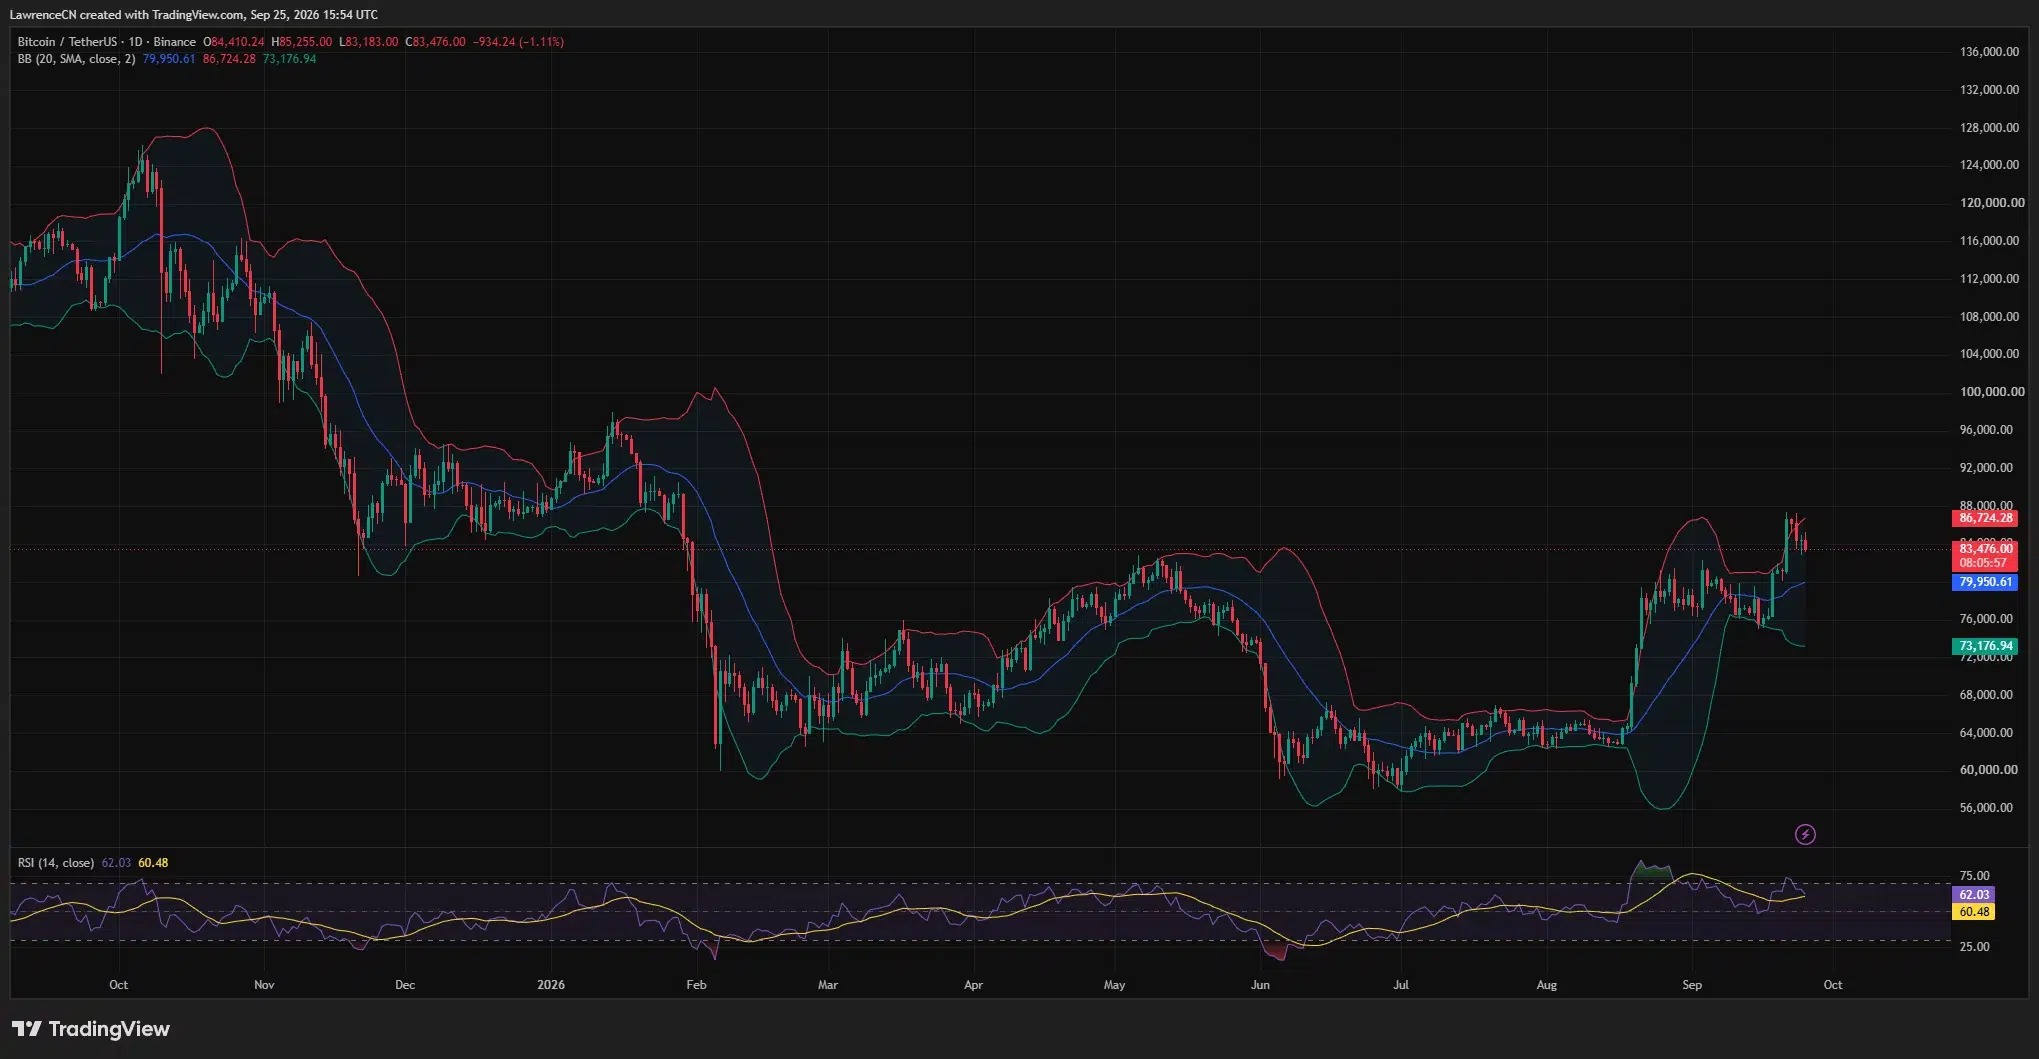


After falling below $80,000 this week, the price of Bitcoin rebounded to around $81,731. However, with the daily chart breaking below the middle band of the Bollinger Bands, traders are divided on whether this rebound will be able to reach $84,000.
Bitcoin was reported at around $81,731 on Binance, a decrease of 2.44% from this week's opening price.
The middle band of the daily Bollinger Bands is at $83,478, and the lower band is close to $80,592.
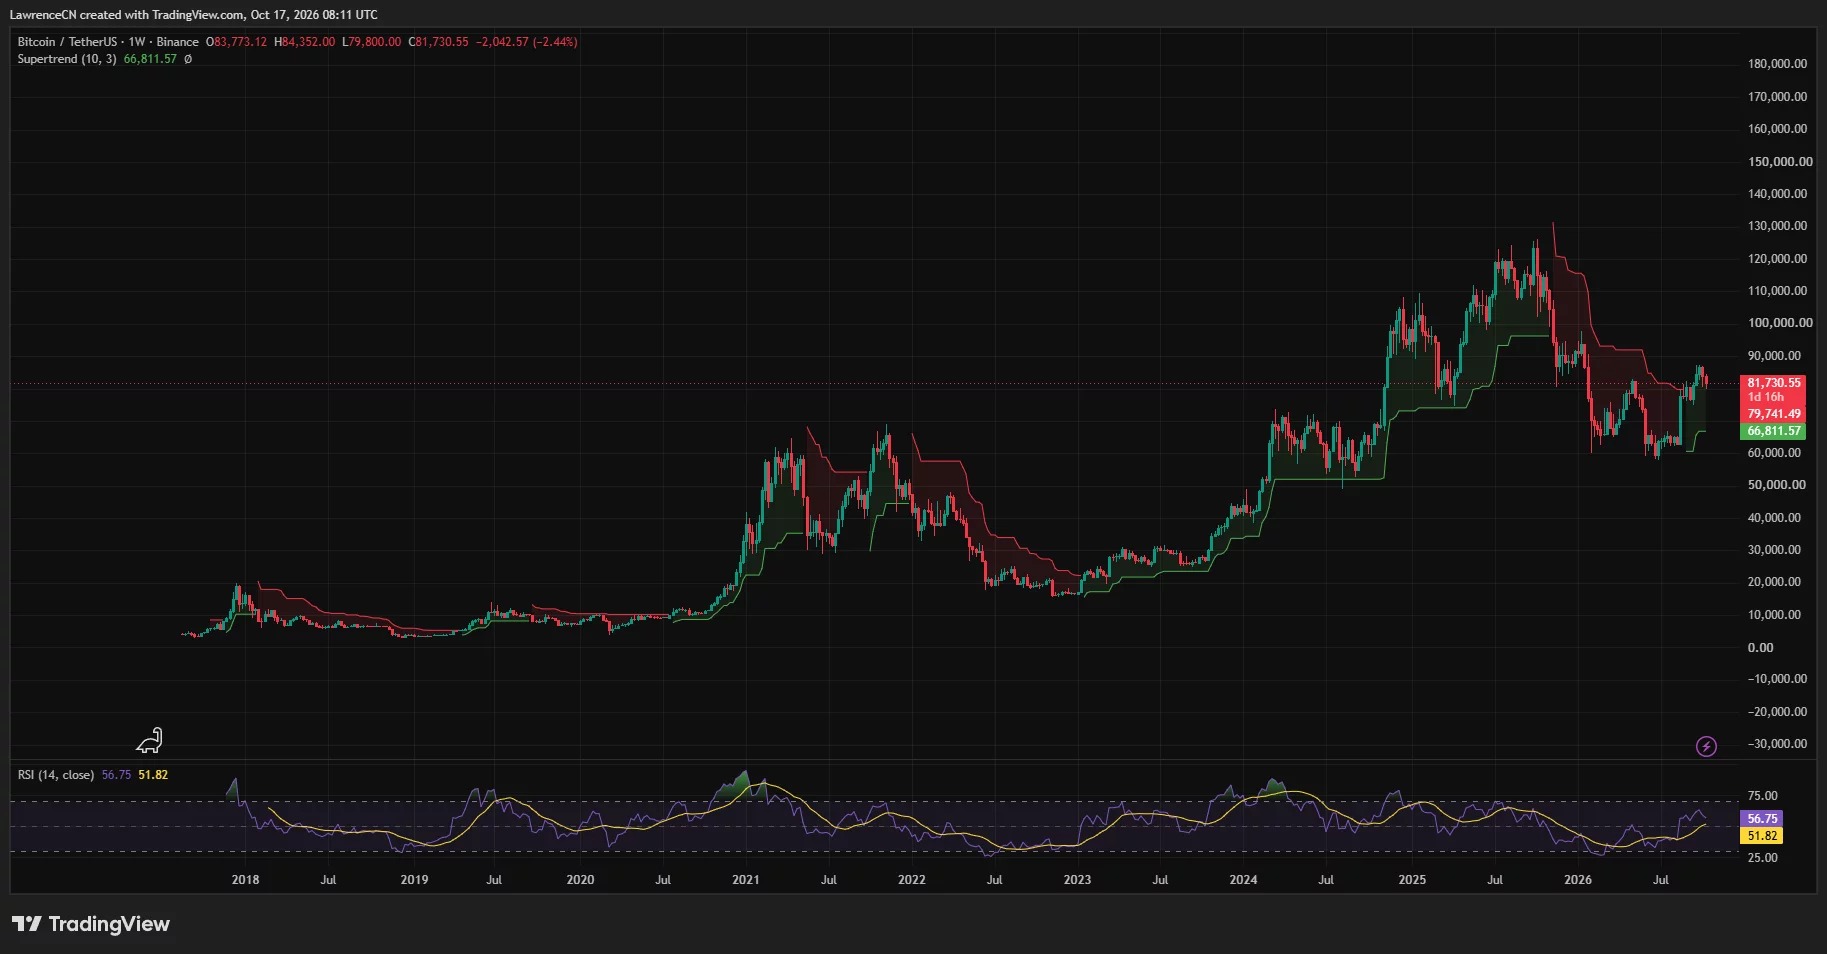
The weekly line RSI is at 56.75, while the green Supertrend line is still close to $66,812.
Market commentator Wealthmanager believes that if Bitcoin breaks through $84,000, $90,000 could become the next target, but this judgment is conditional.
As shown at 8:11 a.m. on UTC on October 17th, the Bitcoin price on the Binance BTC / USDT chart was higher than this week's low of $79,800, but lower than this week's opening price of $83,773. This week's high was $84,352, indicating that the market is still within the range it has previously crossed above and below.
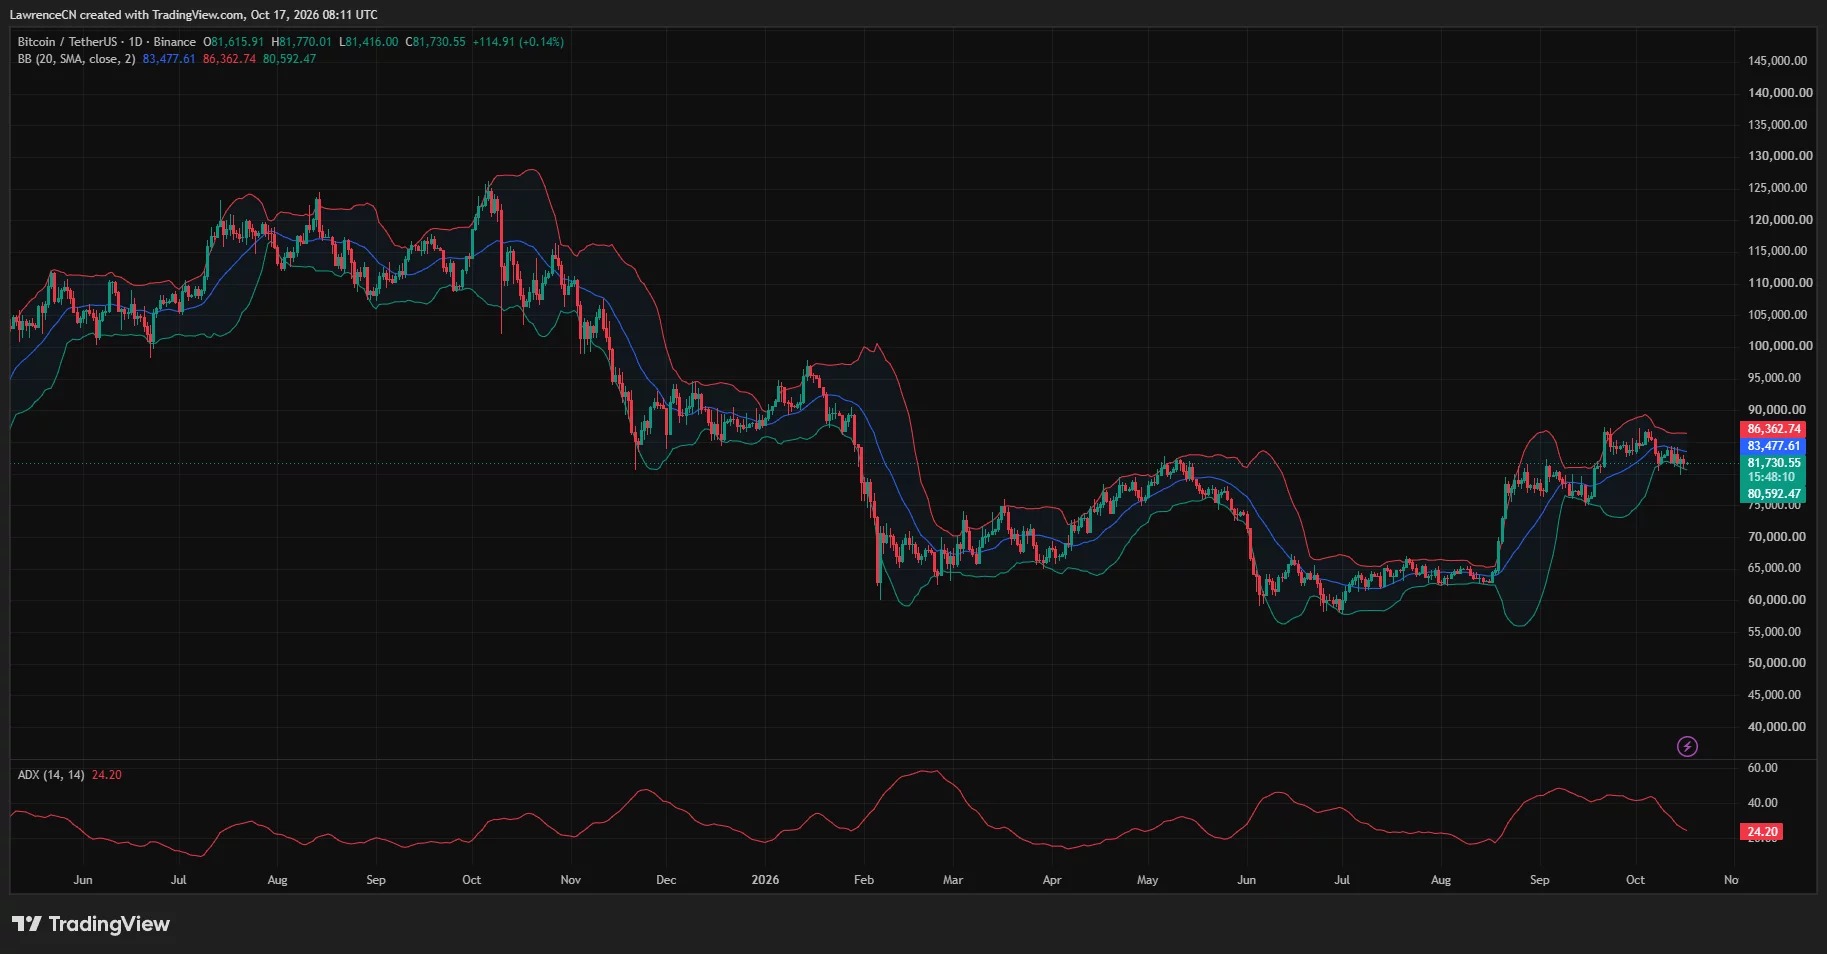
The daily snapshot shows that Bitcoin rose by 0.14% on the day, with prices fluctuating between $81,416 and $81,770. Compared to this week's decline, this small intraday rebound indicates that prices have not yet recovered the ground lost earlier in the week.
The price of Bitcoin is still below the daily median of $83,478.
On the daily chart of TradingView, Bitcoin is below the 20-day simple moving average, which also happens to be the middle band of the Bollinger Bands. The moving average is at $83,477.61, with the upper band at $86,362.74 and the lower band at $80,592.47.
After approaching the $88,000 range in late September and early October, Bitcoin fell back several times on the daily chart. The reading on October 17th TradingView showed that the price was below that range as well as below the middle band of the Bollinger Bands.
The daily average trend index for TradingView, which is ADX, reported 24.20, showing a decline from earlier readings in October. ADX is used to measure the strength of the trend, but it does not determine whether the direction is bullish or bearish; the latest downward trend is indicated by the price chart.
Previously, crypto.news reported that Bitcoin fell below $82,000 on October 14, with its intraday high once exceeding $84,100. Trader Lennart Snyder linked this decline to the release of U.S. inflation data and listed $80,300 as one of its downward targets.
Analysts have differing opinions on the rebound from $80,000.
Market commentator Wealthmanager expressed a conditional bullish view in a post on October 17th, pointing out that Bitcoin had rebounded from $80,000 and mentioned the descending channel formed in the recent price trend.
"If we can break through 84K, $90,000 might be the next goal."
The commentator regards $80,000 as a key level that Bitcoin needs to hold onto. The chart he attached shows that prices may rise along the upper edge of the channel, but this expectation depends on whether a successful breakout can be achieved.
Calculated based on the reference price of TradingView at $81,730.55, a rise to $84,000 would represent an increase of about 2.8%. If it rises to $90,000, that would represent an increase of approximately 10.1% compared to the same benchmark.
Cryptography analyst Jesse Olson made a more cautious assessment on October 16th.
“BTC still shows a bearish trend on the daily chart.”
Olson indicates that the trading session at that time was moving towards the lowest daily closing price of this cycle. His statement reflects the market conditions at the time of the post; whereas the TradingView snapshot from October 17th subsequently showed that Bitcoin trading was around $81,731.
Another assessment on October 16 also pointed out that the market structure was bearish. Trader Ardi stated that he would only consider going long after the price breaks above $84,200, with his target at the top of that range. This threshold is $200 higher than the breakout level mentioned by Wealthmanager.
Weekly chart RSI: Despite price declines, still holding above 50
The weekly chart of TradingView shows that RSI is at 56.75, which is higher than the neutral level of 50 and also above the average value of 51.82 shown on the chart. Despite Bitcoin falling by 2.44% from this week's opening price, the weekly momentum reading still remains above this median line.
The same chart also shows that the green Supertrend line is at $66,811.57. Based on the price shown on the chart and this value, Bitcoin is currently about 22.3% higher than this indicator.
At the level of $66,811.57, the weekly Supertrend line is nearly $13,000 lower than the recent low of $79,800. In contrast, the lower band of the daily Bollinger Bands for TradingView is closer to the current price, being about $792 higher than that week's low point.
An analyst on Bitfinex provided downside conditions on October 6th, stating that if Bitcoin remains below $81,300 and at the same time there is a outflow of funds from ETF, then the levels of $77,000 and $77,200 could once again come into focus. This judgment is based on two criteria: price and capital flow.
The liquidation central area is around $84,500.
The weekly heat map of CoinGlass shows that the brightest area is mainly concentrated around $84,400 to $84,800. A smaller concentrated area appears around $83,200 to $83,700, while the lower areas are located around $80,000 to $80,800 and below $80,000.
This heat map shows the estimated liquidation concentration areas, not the actual liquidations that have already occurred. The price trajectory indicates that prices have rebounded and fallen several times this week, including a period where they dropped below $80,000 before the latest rebound.
U.S. inflation data is part of the context for these transactions. Data released by the U.S. Bureau of Labor Statistics on October 14 showed that the consumer inflation rate in September was 3.7% year-on-year and 0.6% month-on-month.
Producer inflation data released the following day showed that the annual wholesale inflation rate was 6.3%. In the raw data, the Bureau of Labor Statistics recorded a 1.3% month-on-month increase in final demand prices, with commodity prices rising by 2.6% and service prices rising by 0.8%.
Disclosure: This article does not constitute investment advice. The content and materials on this page are for educational purposes only.