

In late October 2026, BTC is fighting in the $79,000-$80,000 range. US spot ETFs just turned to a weekly net inflow of about $301 million, but monthly flows remain a net outflow of $314 million—contradictory signals. Standard Chartered's Kendrick maintains his $100,000 target, but this judgment hinges on improved liquidity and repaired ETF flows materializing simultaneously. So, what's next for Bitcoin below $80,000? Can Standard Chartered's $100,000 target be achieved?
Table: Latest Bitcoin Price Trend Data
| Data Item | Latest Value/Status |
|---|---|
| Bitcoin Price | Approx. $80,129 |
| 24-Hour Change | -0.03% |
| Market Cap | Approx. $1.61 Trillion |
| 24-Hour Trading Volume | Approx. $30 Billion |
| Open Interest (OI) | Approx. $45.3 Billion, up 1.5% in 24 hours |
| Funding Rate | Overall positive, Binance at approx. 0.0068% |
| Daily RSI | Approx. 39.82, approaching oversold territory |
| 24-Hour Network-Wide Liquidations | $175 Million; longs $106 Million, shorts $68.83 Million |
| Long/Short Account Structure | 69.5% long market-wide; 70.5% long among large accounts |
| Key Intraday Support | $79,400–$79,600 range |
Note: The above content is compiled and summarized by CoinMeta based on public market data. Please refer to actual data if there are any fluctuations.
Latest Bitcoin Price Analysis
Current Technical Analysis
According to CoinMeta's Bitcoin 1-day chart, we can analyze that since the previous high (around $88,000), Bitcoin has shown a clear descending channel of "lower highs and lower lows," establishing a short-term bearish trend. The specific analysis is as follows:
Current price: $79,916.01 USDT, up 0.38% in 24 hours, in an extremely narrow range.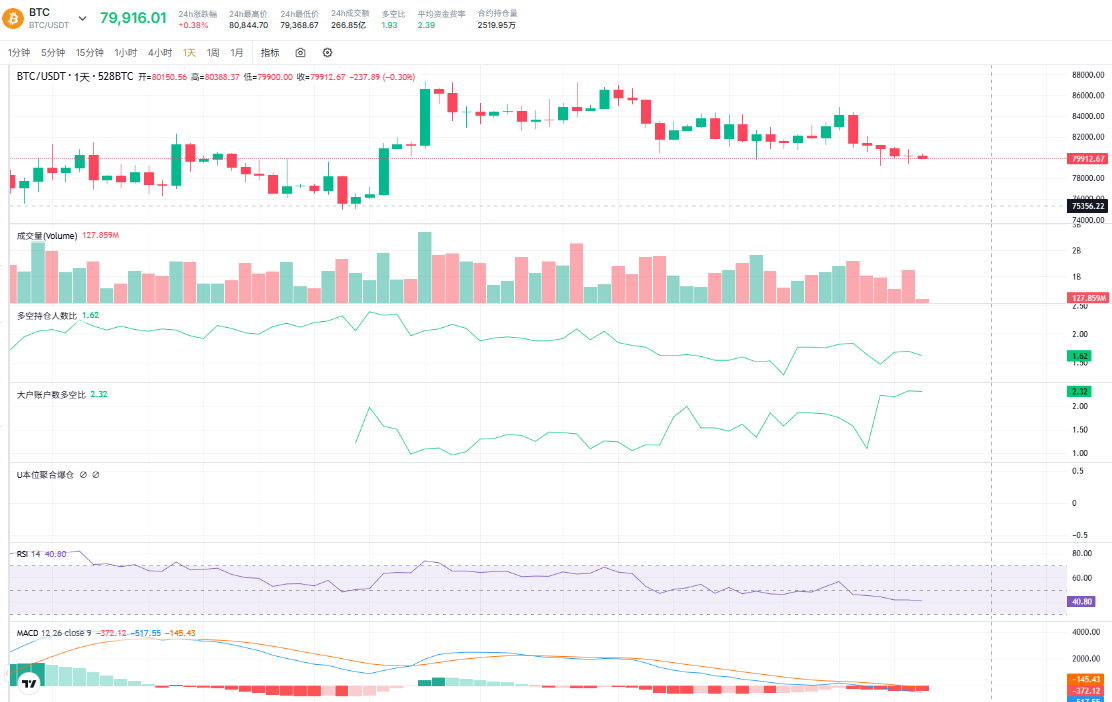
Image: Bitcoin Daily Chart
RSI: Current reading is 40.80, below the 50 boom-bust line, indicating bears are dominating; but it has not yet broken below the 30 "oversold zone." We speculate there is still room for further downside.
MACD: Both lines are below the zero axis, and the fast line (DIF, -372.12) and slow line (DEA, -517.85) have formed a death cross pointing downward, with the possibility of a technical rebound brewing. Long/short position ratio is 1.62: retail is generally long.
Top trader account long/short ratio is 2.32: Whales are heavily long. Our analysis suggests that in a downtrend, both whales and retail holding heavy long positions simultaneously makes it highly likely for market makers to conduct a "downward pin" to liquidate high-leverage longs .
Derivatives Market Analysis
According to CoinMeta's latest Bitcoin liquidation data, we can identify the core characteristic of the current derivatives market: it is in a phase where "high-leverage longs are overly crowded, and market makers are repeatedly hunting them."
Total 24-hour liquidations reached $28.79 million, of which long liquidations were $14.39 million and short liquidations were $14.39 million. The top 3 single BTC liquidations were all on Binance: a $1.17 million long, and shorts of $830,900 and $723,900.
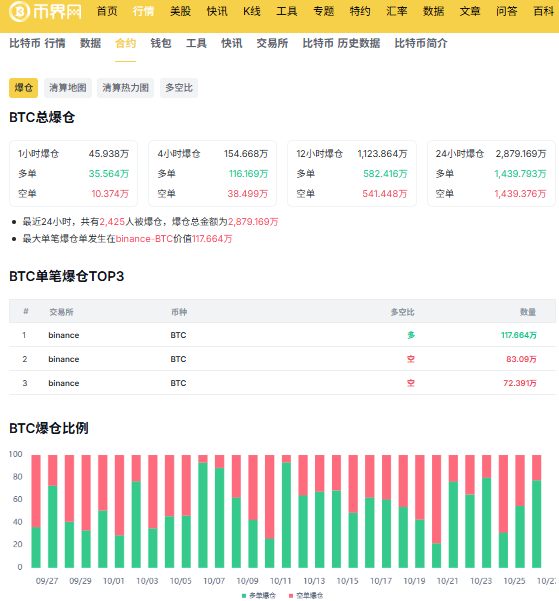
Image: Bitcoin Latest Liquidation Data
The million-dollar single liquidations we see indicate severe divergence even within market maker capital (whales/institutions). Combined with the top trader long/short ratio of 2.32 in the previous chart, this is an absolute danger signal. We can analyze that market makers hold large short positions or spot, deliberately not pushing prices up, but slowly eating away at these crowded long chips through oscillating declines. Combined with the earlier analysis, $80,000 is not only a psychological threshold but also a dense leverage meat grinder for longs and shorts.
What is Driving Bitcoin Below $80,000?
Our analysis finds that the direct drivers of Bitcoin breaking below $80,000 are a short-term resonance of leverage liquidations and ETF redemptions.
From October 22 to 23, US spot Bitcoin ETFs saw a combined net outflow of approximately $773.5 million over two trading days, with BlackRock's IBIT and Fidelity's FBTC accounting for nearly three-quarters of the single-day outflows. During the same period, total 24-hour crypto market liquidations reached $154 million, with long liquidations exceeding 76%. Historically, such data often corresponds to a self-reinforcing phase of panic selling.
In this decline, corporate treasury buying constitutes an underestimated "invisible floor."
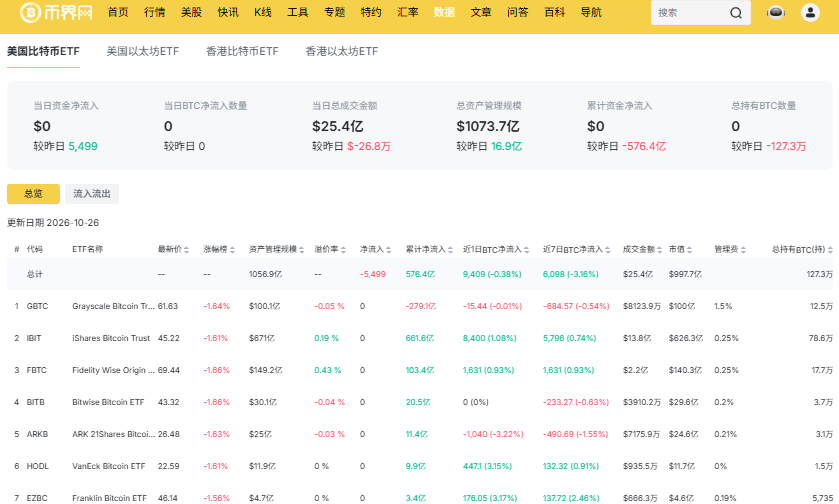
Image: Bitcoin ETF Overview
As of October 2026, Strategy alone holds about 848,000 BTC, accounting for over half of the total 1.64 million BTC held by all corporations. We observe that when BTC trades below $80,000, an increasingly common scenario is institutional buying absorbing the drop rather than triggering cascading panic.
From our perspective, ETFs represent marginal, reversible liquidity, while corporate treasuries represent structural, stickier chip accumulation. The tug-of-war between the two below $80,000 determines that this threshold is more likely a "turnover zone" rather than a "crash point."
Can Standard Chartered's $100,000 Target Still Be Achieved?
Can Standard Chartered's $100,000 target still be achieved against the backdrop of Bitcoin breaking below $80,000?
Standard Chartered's Forecast Basis
In our view, Standard Chartered's $100,000 prediction bets on two specific paths: improved liquidity conditions and continued corporate treasury demand.
In August, Standard Chartered noted that expanding long-term US Treasury buybacks would ease long-end interest rate pressure and improve market liquidity—a policy environment "favored by Bitcoin." Its latest statement on October 17 further marked the $59,000 area as a candidate for a "cyclical low" and explicitly identified ETF net inflows returning as the core signal validating the completion of the bottoming process.
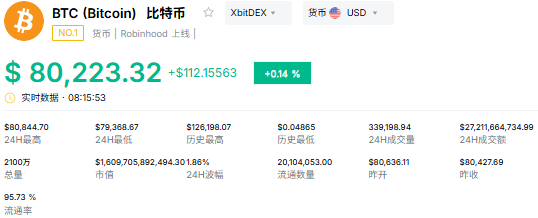
Image: Bitcoin Latest Price
Conditions for Bitcoin to Reach $100,000
Our analysis finds that against the backdrop of Bitcoin breaking below $80,000, Standard Chartered's $100,000 target faces two hard constraints.
First, the direction of the interest rate path remains unfriendly. The October 28 Fed meeting will likely keep rates at 3.75%-4.00%, but market pricing for a December hike has risen to nearly 80%. With high oil prices and ongoing geopolitical conflicts, even if the Fed holds steady, hawkish guidance alone will suppress valuation expansion for risk assets.
Second, corporate treasury buying is not infinite. The sharp slowdown in Strategy's Q3 accumulation pace indicates that tightening financing conditions are materially constraining its purchasing power; the corporate treasury expansion model of the easy financing era is difficult to replicate continuously without relying on stock price premiums.
Our View
Our judgment is: the feasibility of Standard Chartered's $100,000 target does not depend on whether Bitcoin can hold $80,000, but on whether ETF flows can first turn to sustained net inflows within the $78,000-$80,000 range. The Coinbase Bitcoin Premium Index has been negative for 33 consecutive days, indicating weak US buying. If this indicator turns positive while prices stop making new lows, that would be a right-side signal more informative than any single price prediction.
Bitcoin $80,000 FAQ
Q1: Can the $80,000 support hold?
The short-term probability of holding is slightly higher than a breakdown. The $78,000-$79,000 range has accumulated over $80 million in dense buy orders, and the weekly 50 EMA at around $78,600 forms a technical defense line. As long as this range is not broken by a closing price, the $80,000 threshold remains a repairable turnover zone rather than a trend breakdown.
Q2: Does ETF outflow guarantee a Bitcoin price drop?
Not necessarily. Despite a monthly ETF net outflow of $314 million in October, BTC did not break below the $79,000 low, indicating that corporate treasury buying is absorbing the marginal selling pressure from ETFs.
Q3: Does Strategy's continued accumulation mean the price has bottomed?
It cannot be simply equated. Strategy's average holding cost is around $75,446, and the current price is still above its cost line. Its accumulation reflects more of a long-term balance sheet allocation rather than a precise bottom call.
Conclusion: The Distance to $100,000 is Structural, Not Emotional
Our view is that after Bitcoin breaks below $80,000, the next move depends on whether the liquidity defense line in the $78,000-$79,000 range can hold, and whether ETF net inflows can upgrade to "monthly positive." Standard Chartered's $100,000 target is not out of reach, but it has conditions: improved liquidity from Treasury buybacks, a marginally dovish interest rate path in December, and sustained ETF inflows returning. At least two of these three must materialize. We recommend watching whether ETFs are the first to turn to sustained buying. That is the chip that will distinguish Bitcoin's future trend.
Disclaimer: Readers are strictly advised to comply with local laws and regulations. This article is compiled based on public market data for reference and educational purposes only, and does not constitute investment advice. Follow CoinMeta for the latest updates.