

Both are burning cash on AI, so why is the $500 billion penalty falling only on Google? After the market close on October 28, 2026, Microsoft reported Azure growth of 48% and free cash flow (FCF) of $18.6 billion, with its stock rising after hours. Meanwhile, Google's parent company Alphabet reported a negative FCF of -$9.07 billion, marking its largest single-day drop since going public and erasing about $500 billion in market cap. The capital expenditure gap between the two is only about $6 billion, so why is the market pricing them in completely opposite ways?
Table: Latest Google Stock Data
| Data Item | Value |
|---|---|
| Latest Closing Price | $283.82 |
| Single-Day Decline | -12.64% |
| Total Market Cap | Approx. $3.47–$3.49 Trillion |
| P/E Ratio (TTM) | 14.80x |
| P/B Ratio (MRQ) | 5.15x |
| EPS (TTM) | $19.17 |
| Q3 2026 Revenue | $127.577 Billion |
| Q3 2026 Net Profit | $26.170 Billion |
| Google Cloud Q3 Revenue YoY Growth | +103% |
| Analyst Consensus Target Price | $408.09 |
Note: The above content is compiled and summarized by CoinMeta based on public market data. Please refer to actual data if there are any fluctuations.
Where is the Gap Between Google and Microsoft?
Google's market cap evaporated by $500 billion while Microsoft's cash flow turned positive. Where is the gap? Let's first look at capital expenditure.
| Comparison Item | Alphabet | Microsoft |
|---|---|---|
| Capital Expenditure | $51.36 Billion | $45.2 Billion |
| Capital Expenditure YoY Growth | +114% | +30% |
| Operating Cash Flow | $42.3 Billion | - |
| Free Cash Flow (FCF) | -$9.07 Billion | $18.6 Billion |
| FCF vs. Market Expectations | Below Expectations | More Than Double Expectations |
As shown in the table, the capital expenditure gap between the two is about $6.16 billion, not a magnitude-level difference. However, the direction of free cash flow is completely opposite, with a gap of about $27.67 billion. In our view, the core divergence lies in whether capital expenditure is covered by operating cash flow in the same period. Alphabet's spending exceeded its operating cash flow by about $9.06 billion, while Microsoft kept its FCF significantly positive while spending below its own guidance, exceeding market expectations.
Why Did Google Lose $500 Billion? Why Is the Market Only Punishing Google?
Why is Google's "high growth" unconvincing? We can analyze this from the following three points.
Google's Cash Cow Is at the Epicenter of the AI Narrative
Microsoft's AI growth is an "addition": Azure grew 48% to $33.17 billion, and commercial remaining performance obligations (RPO) soared to $677 billion, up 73% year-over-year. Nearly all of the newly added $260 billion comes from multi-year contracts enterprises signed to pay for AI computing power.
Google's AI growth, however, comes with a layer of "subtraction."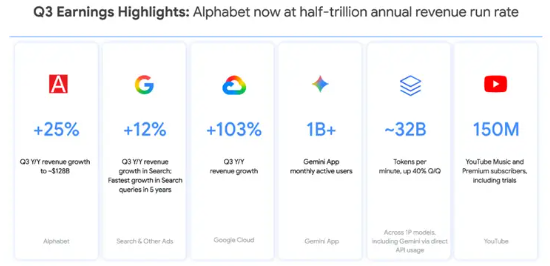
Image: Google Q3 2026 Ad Revenue up 12%
Search ad revenue was $63.35 billion, up 12% year-over-year, below market expectations of 14.7% and slowing significantly from the 17% growth in previous quarters. Management also admitted on the earnings call that while search volume for AI Mode is growing rapidly, monetization efficiency is lower than traditional search. In short, query volume is rising, but money isn't keeping pace—and search ads are Alphabet's largest source of profit. As the most profitable business starts to decelerate, the market is more sensitive to it, and Google takes the hit first when bad news emerges.
Google's Free Cash Flow Turned Negative
In our analysis, the second reason for Google's $500 billion market cap loss is Alphabet's negative free cash flow.
In fact, operating cash flow of $42.3 billion is not weak in itself; it's because capital expenditure ($51.4 billion) systematically exceeded operating cash flow. FCF was already -$5.86 billion in Q2, making it negative for two consecutive quarters. To fill the gap, Alphabet issued $28.7 billion in notes during the first quarter, pushing long-term debt to $125.1 billion.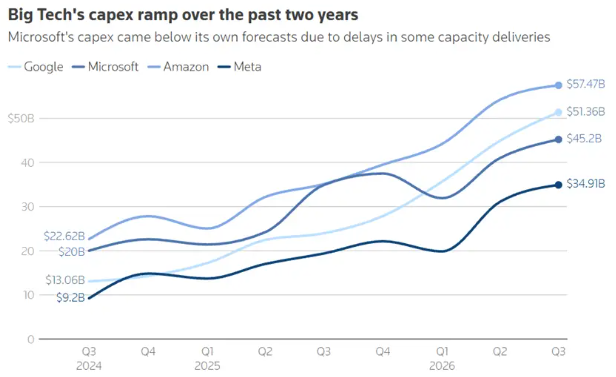
Image: Alphabet's Negative Free Cash Flow
When a company's AI investment begins to require external debt to support, and its core business growth is slowing, the market prices this as a financial burden.
Although Microsoft's FCF fell 27% year-over-year, it remained positive at $18.6 billion and significantly beat expectations. This forms a strong positive contrast with Google. Conversely, Google has a higher proportion of data center and long-cycle infrastructure spending, which naturally has a longer payback period and is more likely to be discounted.Google's Additional Off-Balance-Sheet Penalties
Besides AI cash burn and decelerating search ads, Google faces another pressure that Microsoft does not currently have.
Specifically: the antitrust lawsuit in its ad tech business is still ongoing, with publishers claiming significant damages; and it paid $5.2 billion in EU antitrust fines this quarter in cash. Our analysis suggests these issues are not directly reflected in search and cloud revenue, but investors think one step further when valuing Google: What if it gets ordered to break up or faces more fines one day?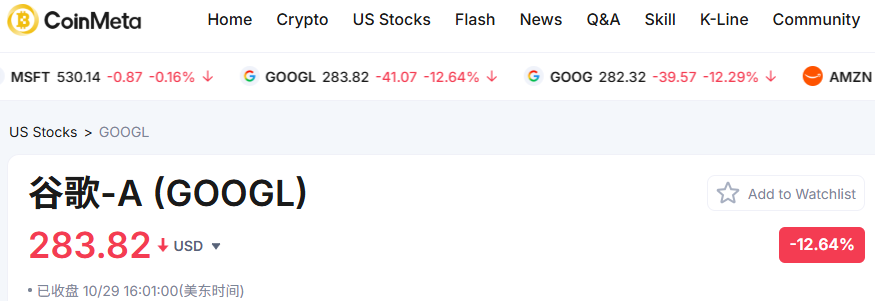
Image: Google Current Stock Price
As a result, the same AI ROI anxiety is amplified on Google, and investors naturally have a lower tolerance for short-term disappointment. Microsoft currently lacks structural regulatory threats of a similar magnitude, giving it a naturally wider margin for error.
Why Can Microsoft Maintain Positive Cash Flow?
Why did Microsoft's cash flow turn positive while Google's market cap erased $500 billion? In our view, there are three main reasons Microsoft's FCF remains positive.
First, the 48% growth in Azure is revenue with a verifiable source. Enterprise AI computing demand has entered core billing systems; it's a business where customers are actually paying, not a concept stuck in a testing environment.Second, capital expenditure was $45.2 billion, below its own guidance of $50 billion. This was partly due to delays in third-party computing delivery, but objectively it made the rate of spending slower than the rate of revenue recognition in the quarter, making cash flow look better.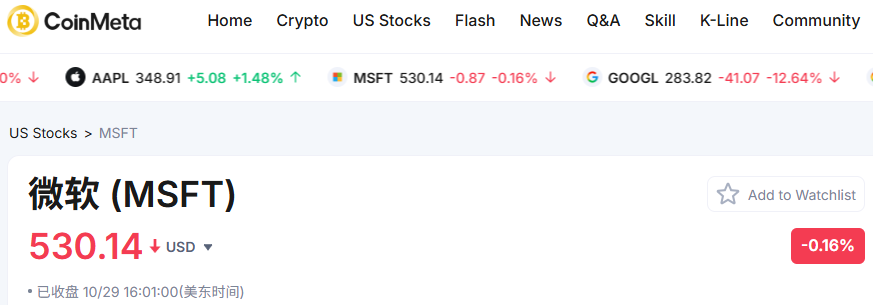
Image: Microsoft Current Stock Price
Third, Microsoft has more room for adjustment in leasing and accounting treatments: it uses more third-party data center leases, some classified as operating leases rather than finance leases, so related expenditures do not directly hit capital expenditure and FCF metrics; at the same time, it extended depreciation periods from 15 to 25 years, mitigating the impact of single-period depreciation on profits. These operations do not change the actual total computing investment, but they change the numbers the market sees.
Therefore, our core judgment is: the key is not that "Microsoft is more frugal," but that it makes the market "understand" how the money is earned back. The market does not reward who spends less; it rewards a traceable, verifiable transmission chain between spending and revenue.FAQ
Q: Why is Microsoft's free cash flow positive?
Microsoft's FCF is positive primarily because Azure's revenue growth outpaced capital expenditure growth. Azure grew 48% to $33.17 billion in the quarter, with commercial remaining performance obligations at $677 billion. Future revenue visibility supports cash flow coverage.
Q: Is Google's negative cash flow a sign of operational deterioration?
It is not operational deterioration; it is capital expenditure exceeding operating cash flow. Alphabet's operating cash flow for the quarter was about $42.3 billion, so its core business is not bleeding cash. However, capital expenditure was $51.36 billion, leaving a gap of about $9.07 billion, and it has been negative for two consecutive quarters.
Q: Google's search volume is rising, so why are ad revenues slowing?
Because AI Mode query volume is rising, but monetization efficiency per search is declining. Google's search query growth is the highest in five years, and AI Mode monthly active users have exceeded 1 billion. However, ad loading in AI search is not yet mature, and revenue per query is lower than traditional search. Combined with currency effects and industry budgets normalizing, search ad growth dropped from 19% in Q1 to 17% in Q2 and 12% in Q3. "Volume up, price down" directly triggered a valuation discount.
Conclusion
Google's market cap evaporated by $500 billion while Microsoft's cash flow turned positive. In our view, the market penalty reflects the inability to see cash flow returning after spending. Google's search ad growth dropped from 19% to 12%; AI Mode query volume is rising, but per-query monetization is falling; and negative free cash flow happened in the same quarter as the cash cow decelerated. Microsoft's positive FCF is not the final answer either; if Azure growth reverses while capital expenditure continues to climb, the same cash flow narrative will backfire in the same way. The difference is: Microsoft has shown the market the path to returns, while Google has not yet.
Disclaimer: Readers are strictly advised to comply with local laws and regulations. This article is compiled based on public market data for reference and educational purposes only, and does not constitute investment advice. Follow CoinMeta for the latest updates.