











What is Bitcoin's November price trend? Can it hit $90,000? As of press time, Bitcoin is hovering around $78,000, just a step away from the $90,000 mark, but facing heavy overhead resistance. Although November is historically a strong month, the market currently faces a complex situation involving ETF outflows, macro interest rate suppression, and extreme liquidation of longs in the derivatives market. We will combine the daily chart and liquidation data to deeply analyze the real probability and key conditions for a run at $90,000.
Table: Overview of Latest Bitcoin Data
| Dimension | Data |
|---|---|
| Bitcoin Price | Approx. $78,412, up 1.1% in 24 hours |
| Bitcoin Market Cap | Approx. $1.57 Trillion |
| 24-Hour Network-Wide Trading Volume | Approx. $105 Billion |
| Bitcoin Dominance | 58.5% |
| US Spot Bitcoin ETF Single-Day Net Outflow | $643.2 Million; October cumulative net outflow approx. $516 Million |
| Bitcoin Derivatives Open Interest | Approx. $28 Billion, up 3% from 24 hours earlier |
| Crypto Futures Market Forced Liquidations | Approx. $1.6 Billion, including $522 Million in Bitcoin futures liquidations |
| Fear & Greed Index | 37, in the "Fear" zone |
| Daily RSI | Approx. 36–41 range, in weak territory |
| Fed Federal Funds Rate | 3.75%–4.00%, unchanged at the October meeting |
Note: The above content is compiled and summarized by CoinMeta based on public market data. Please refer to actual data if there are any fluctuations.
Bitcoin Current Technical Analysis
Bitcoin Daily Chart Analysis
According to CoinMeta's Bitcoin (BTC/USDT) daily chart, we can see Bitcoin at a price level of 78,486 USDT. Here is an in-depth technical chart analysis:
Current Pattern: Looking at the candlestick patterns, after Bitcoin's price was rejected near $88,000 in October, it formed an obvious "double top" or "lower highs after a peak" pattern, with a lowest pullback to the $76,000 area. Currently, the price is in a rebound repair phase but overall remains in a wide-ranging descending channel, with lower highs: 88k → 82k → 78k.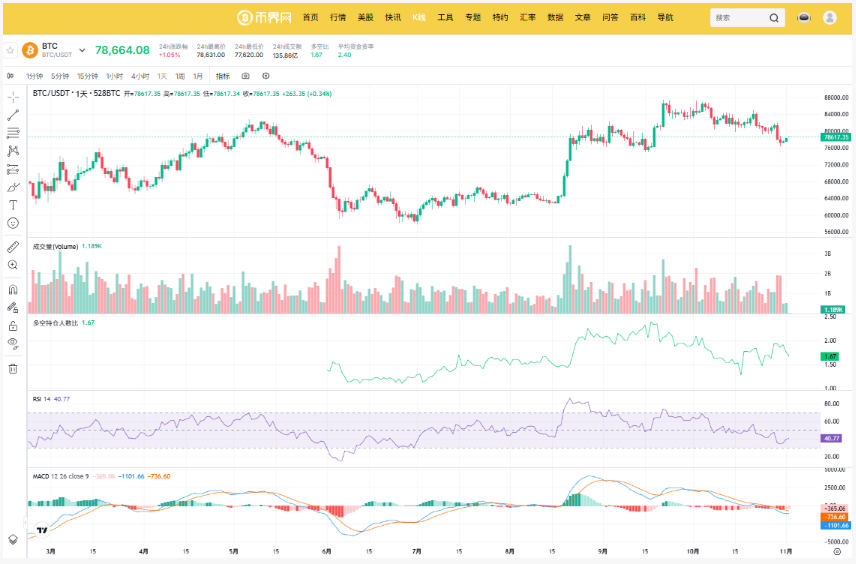
Image: Bitcoin Daily Chart
Support and Resistance: The $76,000-$77,000 range below is a recent strong support zone. The first resistance above is at $80,000-$82,000, with strong resistance at $84,000-$85,000. Our analysis suggests that from the chart's perspective, there is still about 15% of space to $90,000. With heavy resistance, to make a run at $90,000, the price must first effectively break through and hold the $82,000 and $85,000 thresholds.
Derivatives Market Analysis
According to CoinMeta Bitcoin derivatives data, the current market reveals strong signals of a "long squeeze" and "market makers washing out leverage." Here is the in-depth derivatives data analysis:
In the past 24 hours, total long liquidations ($2.595 million) significantly exceeded total short liquidations ($1.917 million); in the 4-hour and 12-hour timeframes, long liquidations were almost 1.3 times or more than shorts.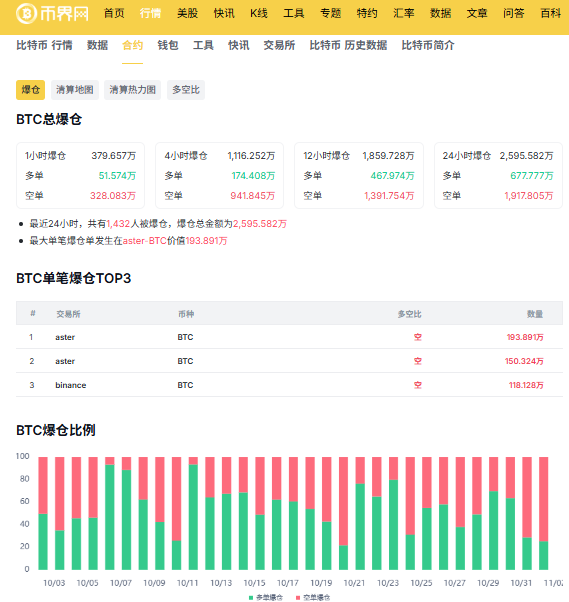
Image: Bitcoin Derivatives Market Data
Strikingly, the "Top 3 single liquidations" were all long liquidations and concentrated on Aster and Binance. The largest single liquidation occurred on Aster at $1.9389 million, followed by $1.5 million and $1.18 million on Binance.
We can analyze that even institutions or whales with massive capital cannot escape liquidation when fighting the trend. Combined with the "long/short account ratio of 1.67" in the previous daily chart, meaning far more longs than shorts, for Bitcoin to truly stabilize and sprint higher in November, a fake breakdown downward—for example, testing $76,000 or even lower—is needed to trigger larger cascading long liquidations, create extreme panic, wash out floating chips, and then stage a strong short squeeze rally.
Where is Bitcoin in the Cycle?
On-chain data provides us with another dimension of confirmation.
Over the past 30 days, short-term holders reduced their holdings by about 290,000 BTC, while long-term holders, ETFs, and structured strategies combined absorbed over 370,000 BTC. During the decline, long-term holders transferred only about 480 BTC per hour to exchanges, about one-fifth that of short-term holders, and the peak inflow of short-term holders was also below the level seen on October 8.Chips are transferring from weak hands to strong hands, which is a typical feature of a bottoming area. We see Bitcoin's current positioning as closer to "structural bottoming."
What Are the Real Obstacles to Bitcoin at $90,000?
For Bitcoin's November price trend to reach $90,000, it first needs to confront the fact that the drivers of this rebound are uneven.
Bitcoin ETFs
On October 31, US spot Bitcoin ETFs saw a single-day net outflow of $643.2 million, the largest single-day outflow since October; weekly net outflows were about $202 million, and cumulative net outflows in October were about $516 million. Additionally, derivative open interest continues to expand. Coinalyze data shows Bitcoin derivatives open interest reaching $28 billion, up 3% in 24 hours. Spot capital is withdrawing while leveraged capital is entering.
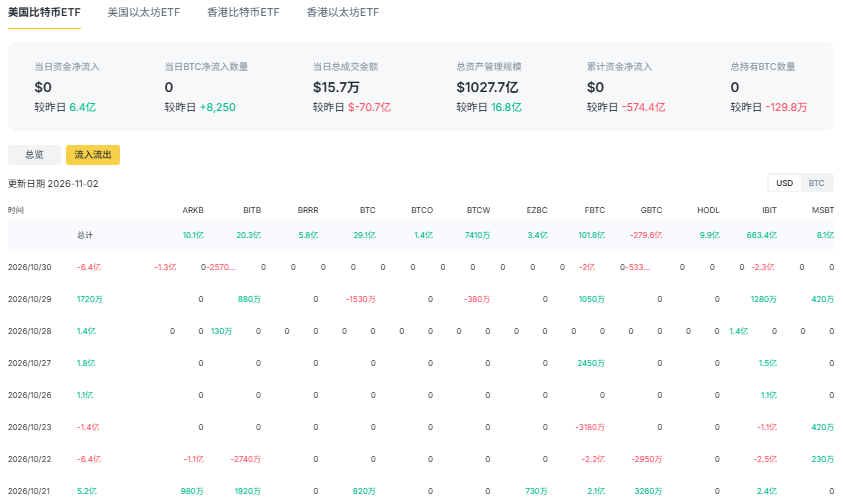
Image: US Spot Bitcoin ETF Inflows and Outflows
Macro Interest Rate Environment
The Fed kept its benchmark rate at 3.75%-4.00% on October 28, and market pricing for a December rate hike has risen above 70%. The Fed has recently collectively signaled that there is room for at least two more 25 basis point hikes. In our view, Bitcoin, as an asset highly sensitive to liquidity conditions, lacks a macro foundation at $90,000 in such an environment and will struggle to push the price up.
What Conditions Are Needed for Bitcoin to Sprint to $90,000?
What conditions are needed for Bitcoin to sprint to $90,000 in November? In our view, it requires the resonance of three conditions rather than a single catalyst.
First, ETF fund flows need to turn from net outflows to sustained net inflows. Cumulative outflows in October currently stand at $516 million. If ETF flows fail to reverse direction around mid-November, any derivative-driven rebound could be cut short by spot selling pressure.
Second, macro interest rate expectations need to show marginal loosening. The jobs data on November 6 is a key observation point: if the data is weak enough for the market to reprice the rate hike path, pressure on risk assets will ease temporarily; but if the data is merely "weak but not recessionary," the Fed's hawkish stance may instead be reinforced.
Third, the price needs to effectively hold above $80,000 with volume confirmation. Bitcoin is currently near $78,000, and $80,000 is the first threshold that must be conquered with spot buying.
We also note an easily overlooked perspective:
November 2026 is not the "acceleration phase" of the post-halving bull market, but closer to a complex mid-cycle correction. The reason November 2017 and November 2021 became historical peak months corresponds to the roughly 17-18 months post-halving peaking rhythm; at the current cycle position, both macro liquidity and the marginal effects of halving supply contraction are exhibiting changes different from the previous two cycles. Linearly extrapolating historical average November gains to $90,000 is methodologically invalid.
Conclusion
What is Bitcoin's November price trend? Can it hit $90,000? In our view, Bitcoin's November price trend is likely to be range-bound consolidation, and a direct sprint to $90,000 is extremely difficult. Technically, the bottom is not yet stable, and derivatives data reveals the brutal washout of a "long squeeze." A run at $90,000 requires the resonance of spot capital entry, macro policy loosening, and technical breakthroughs. It is recommended to closely watch the key resistance at $80,000, guard against high-leverage liquidation risks, and wait for the market to complete structural bottoming before making right-side positioning.
FAQ
Q: Can Bitcoin rise to $90,000 in November?
A: The short-term probability is relatively low. The current price is hovering at $78,000, constrained by spot ETF outflows and the Fed's hawkish stance, lacking a macro foundation for sustained gains. We speculate that mid-to-early November will most likely see range-bound turnover between $75,000 and $83,000.
Q: Does heavy long liquidation mean the bottom is in?
A: Not necessarily; it may continue to wash out downward. Data shows severe long liquidations within 24 hours and a retail long ratio as high as 1.67. Market makers typically use a downward pin (wick) to liquidate high-leverage longs. Only after thoroughly crushing retail confidence and completing deleveraging can a true bottom form.
Q: Can I buy when the daily MACD histogram shrinks?
A: It cannot be used as the sole basis for buying. A shrinking histogram only indicates weakening bearish momentum and is a weak stabilization signal. Before derivatives data is thoroughly washed out, prices are highly prone to repeated fluctuations.
Disclaimer: Readers are strictly advised to comply with local laws and regulations. This article is compiled based on public market data for reference and educational purposes only, and does not constitute investment advice. Follow CoinMeta for the latest updates.