












Ethereum fell back to around $2240 after failing to rebound to near $2450, and the price outlook for November depends on whether buyers can hold the support level and rebuild momentum.
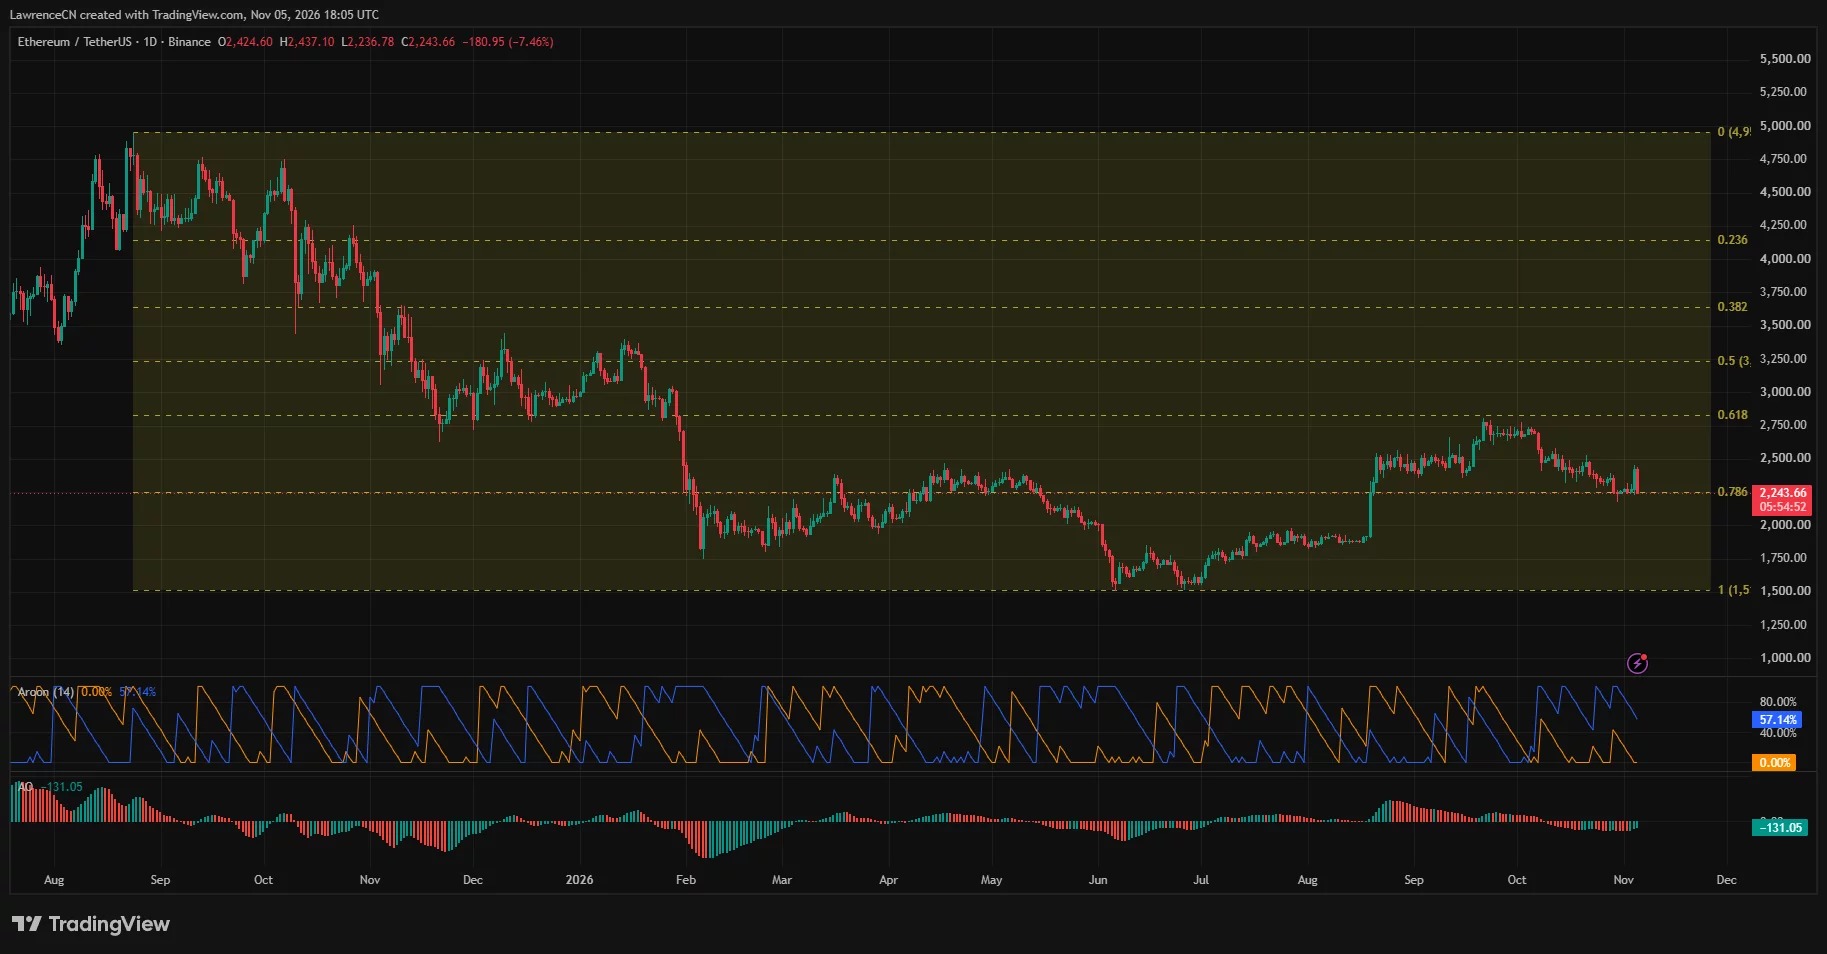
As shown on the daily chart as of November 5th, ETH was trading around $2,244, with a decline of 7.46% for the day.
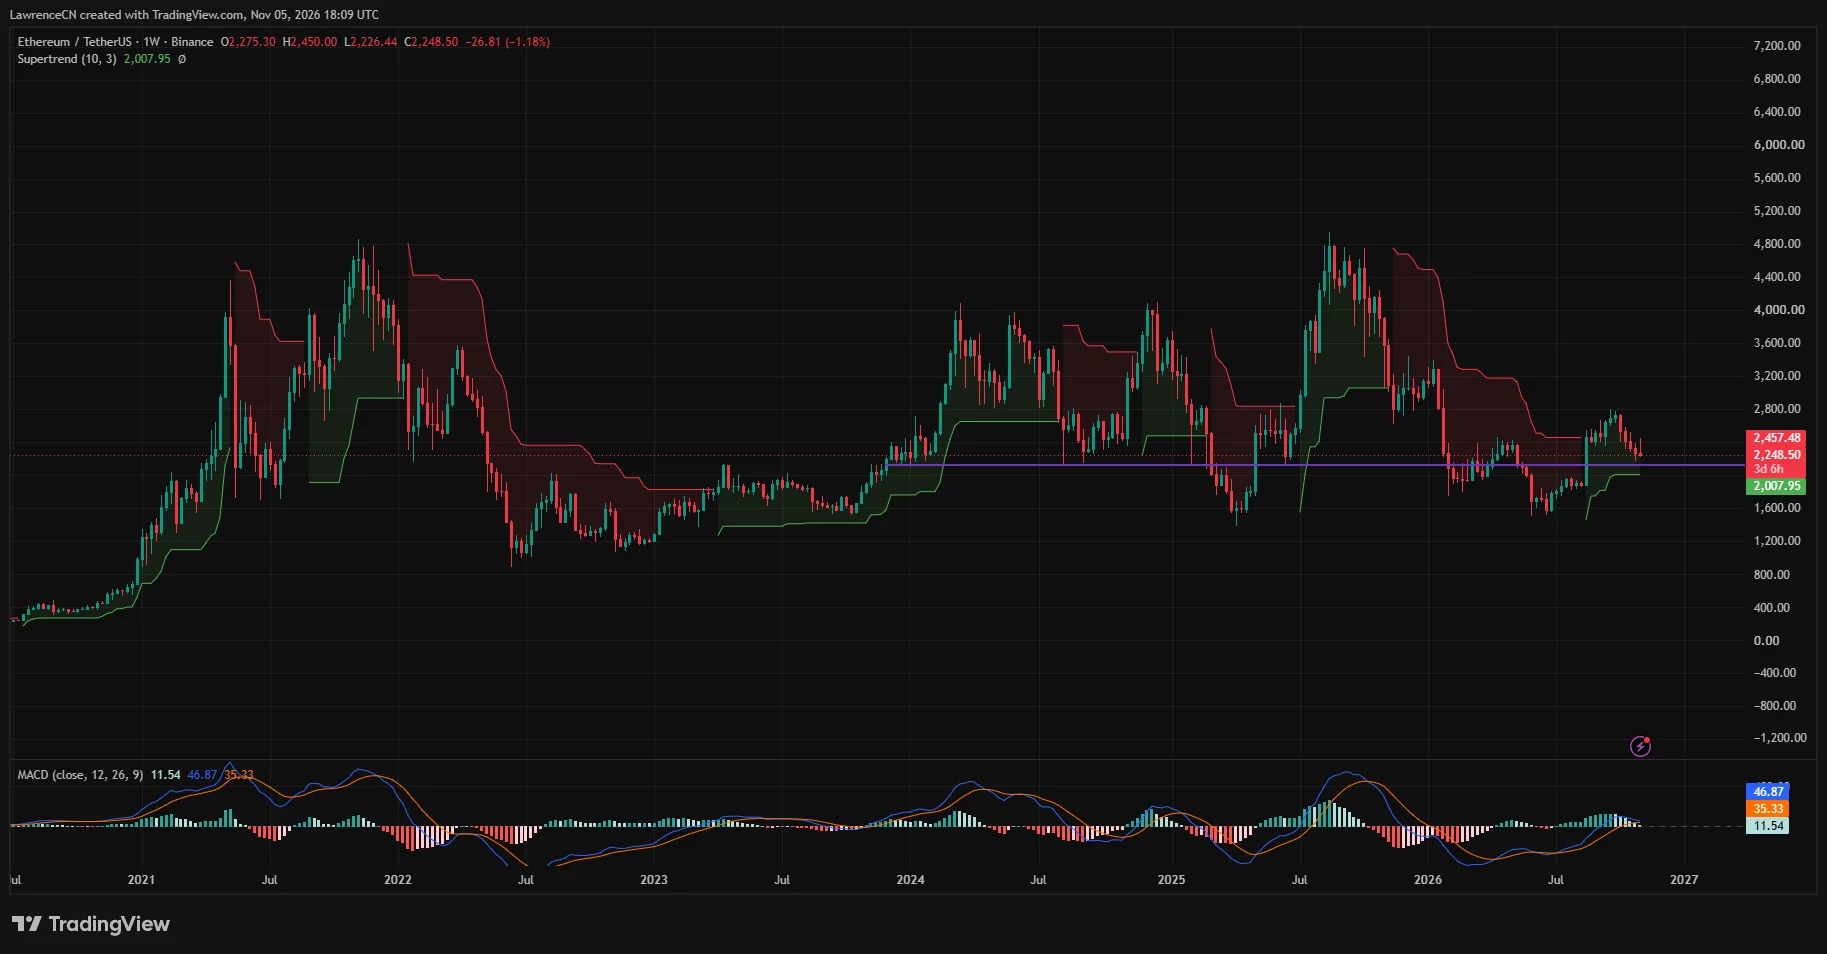
The daily Fibonacci support level is around $2,240, while the weekly Supertrend support level is around $2,008.
Analysts regard $2,800 and $3,000 as potential rebound targets, but there is still significant resistance below these levels.
On November 4th, Ethereum in the United States ETF recorded a capital inflow of 53 million US dollars, following two consecutive trading days of capital outflows.
Ethereum price returns to support level after another rejection
The Binance ETH / USDT daily chart on TradingView shows that as of 18:05 on November 5th, Ethereum was at $2243.66, close to the intraday low of $2236.78. The price had previously rebounded to the $2440 range, but then fell back to the range that buyers had held onto since early November.
On November 1st, ETH once reached back above $2,250 and traded around $2,270, as previously reported for crypto.news. After a brief rise in price, it returned to this range, indicating that Ethereum has made almost no substantial progress in the recent round of rebound.
The daily Fibonacci retracement range covering approximately $1,500 to $4,950 shows that the 0.786 level is around $2,240. At the time the chart was taken, the price was near this level; the 0.618 level within the same retracement range is around $2,800.
If the price continues to fall below the current support range, it will expose the recent lows around $2,170 to $2,200. Below these levels, trader Daan Crypto Trades believes that $2,100 is a more important long-term level.
"From a higher time frame perspective, the truly important levels are 2.1K and 2.8K," he posted on November 5th after Ethereum's rejection.
His range analysis indicates that there is still considerable room for price fluctuations before either boundary is breached. Based on the reference price of $2,244 on the daily chart, a return to $2,800 would represent a rise of about 25%; whereas a drop to $2,100 would indicate a decline of approximately 6.4%.
Ethereum's weekly rebound continues, but the daily momentum is weakening.
The weekly chart presents a less pessimistic picture. Ethereum is still above the green Supertrend line at $2007.95, which allows the upward trend signal of this indicator to be maintained, despite the price having fallen from its highs in September and October.
The weekly line MACD is at 46.87, the signal line is at 35.33, and the bar chart shows a positive value of 11.54. However, the bar chart has begun to shrink, indicating that as the price falls, the previous rebound is losing its momentum.
In this mixed context, analyst Micha ël van de Poppe posted on November 5th that Ethereum could break through to $3,000. His analysis relies on support around $2,300 and expects the price to first pull back slightly to around $2,370 before gaining buying interest again.
By the time of the subsequent chart snapshots, ETH had already fallen below these two levels. Therefore, regaining above $2300 would represent a preliminary correction to that assessment, while the recent rejection range between $2440 and $2450 is still above that level.
A rise from $2,244 to $3,000 would require a nearly 34% increase. His prediction is higher than the upper range of $2,800 mentioned by Daan. Therefore, before a higher target comes into view, regaining the high point of that range will be an intermediate obstacle.
The one-month heat map of CoinGlass shows a clear concentration area around $2,430 to $2,460, and an even stronger zone near $2,635. These areas indicate potential clearing pressure above the current price; if Ethereum rebounds, these will still be the target areas that can only be reached under certain conditions.
ETF Capital flow has returned to normal, but there was still a net outflow in November as a whole.
The improved fund demand has provided some support for bullish forecasts. The capital flow chart of Farside Investors shows that on November 4th, Ethereum in the United States recorded a net inflow of 53 million US dollars. Among this, BlackRock saw an inflow of 32.8 million US dollars, and Fidelity had an inflow of 19.2 million US dollars.
On this day, the net inflow occurred after a net outflow of $139.7 million on November 2nd and $85.3 million on November 3rd. Over the three days, there was still a net outflow of $172 million from the fund, with the inflow on November 4th being less than a quarter of the outflow in the previous two days.
Previously, the pressure was mainly focused on BlackRock's Ethereum products. According to the tracking by Lookonchain, the update on November 2nd showed that there was a monthly net outflow of 580,145 ETH, worth 1.32 billion US dollars.
In another post on November 5th, analyst Joep Gerla pointed out that the weekly chart structure might be bullish, and at the same time, the dominance of altcoins broke through a two-year downward trend. His chart showed consecutive arc bottoms, with the latest pattern maintaining itself above the mid-year lows.
Disclosure: This article does not constitute investment advice. The content and materials on this page are for educational purposes only.