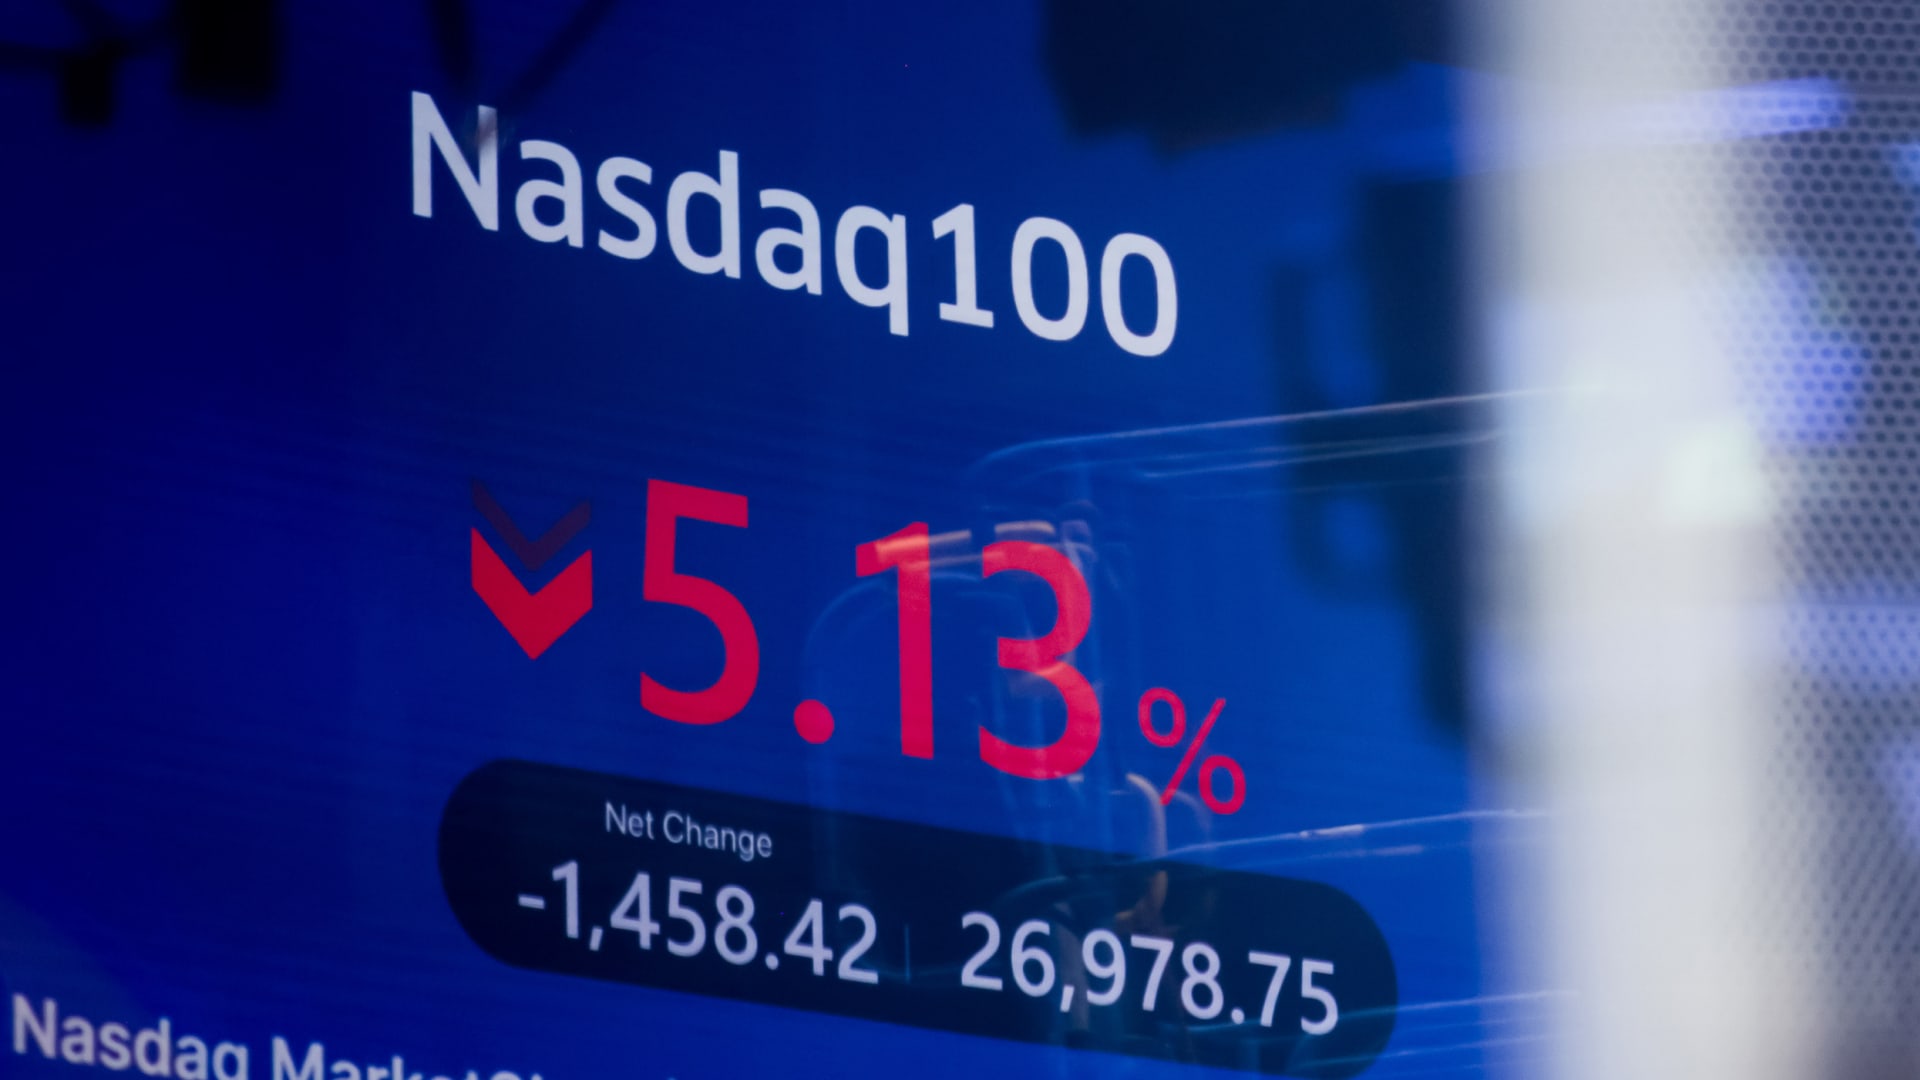


Bitcoin fell to around $75,800 on November 6th, and buyers are holding the $75,000 level, but weak daily momentum poses a challenge to analysts' expectations of a rebound to $81,000 to $82,000.
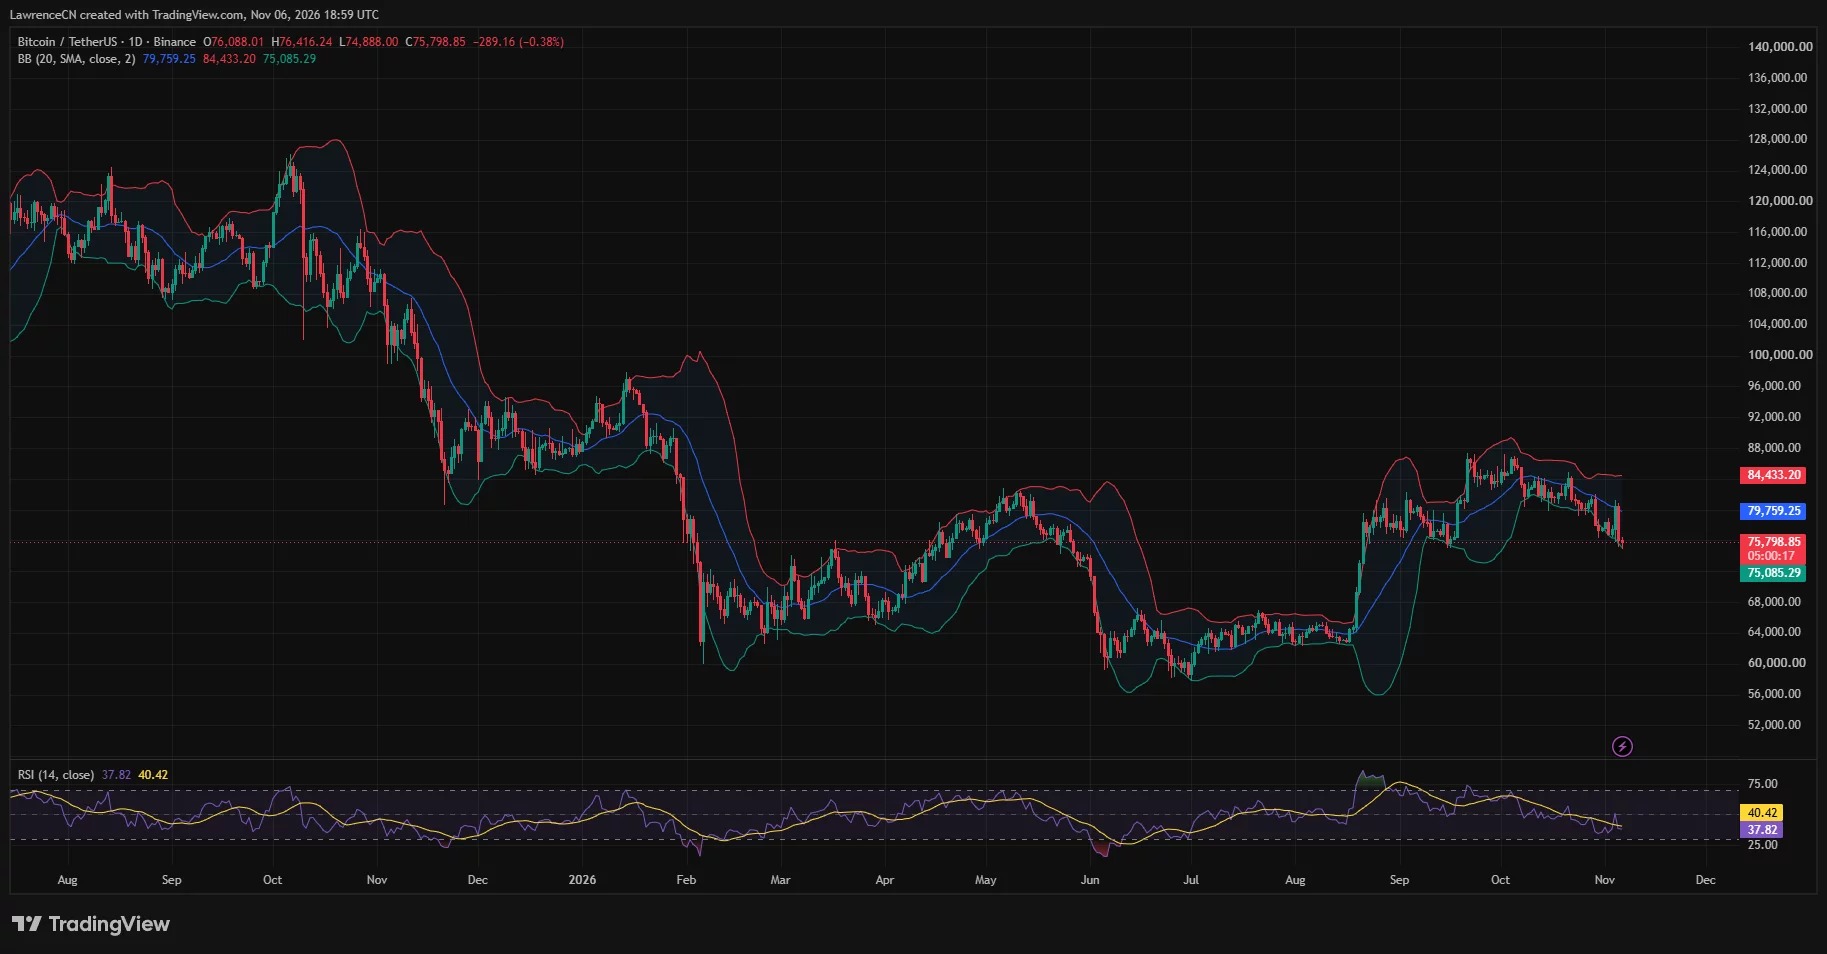
Bitcoin trading is approaching the lower band of the daily Bollinger Bands, with RSI below the neutral level at 37.82.
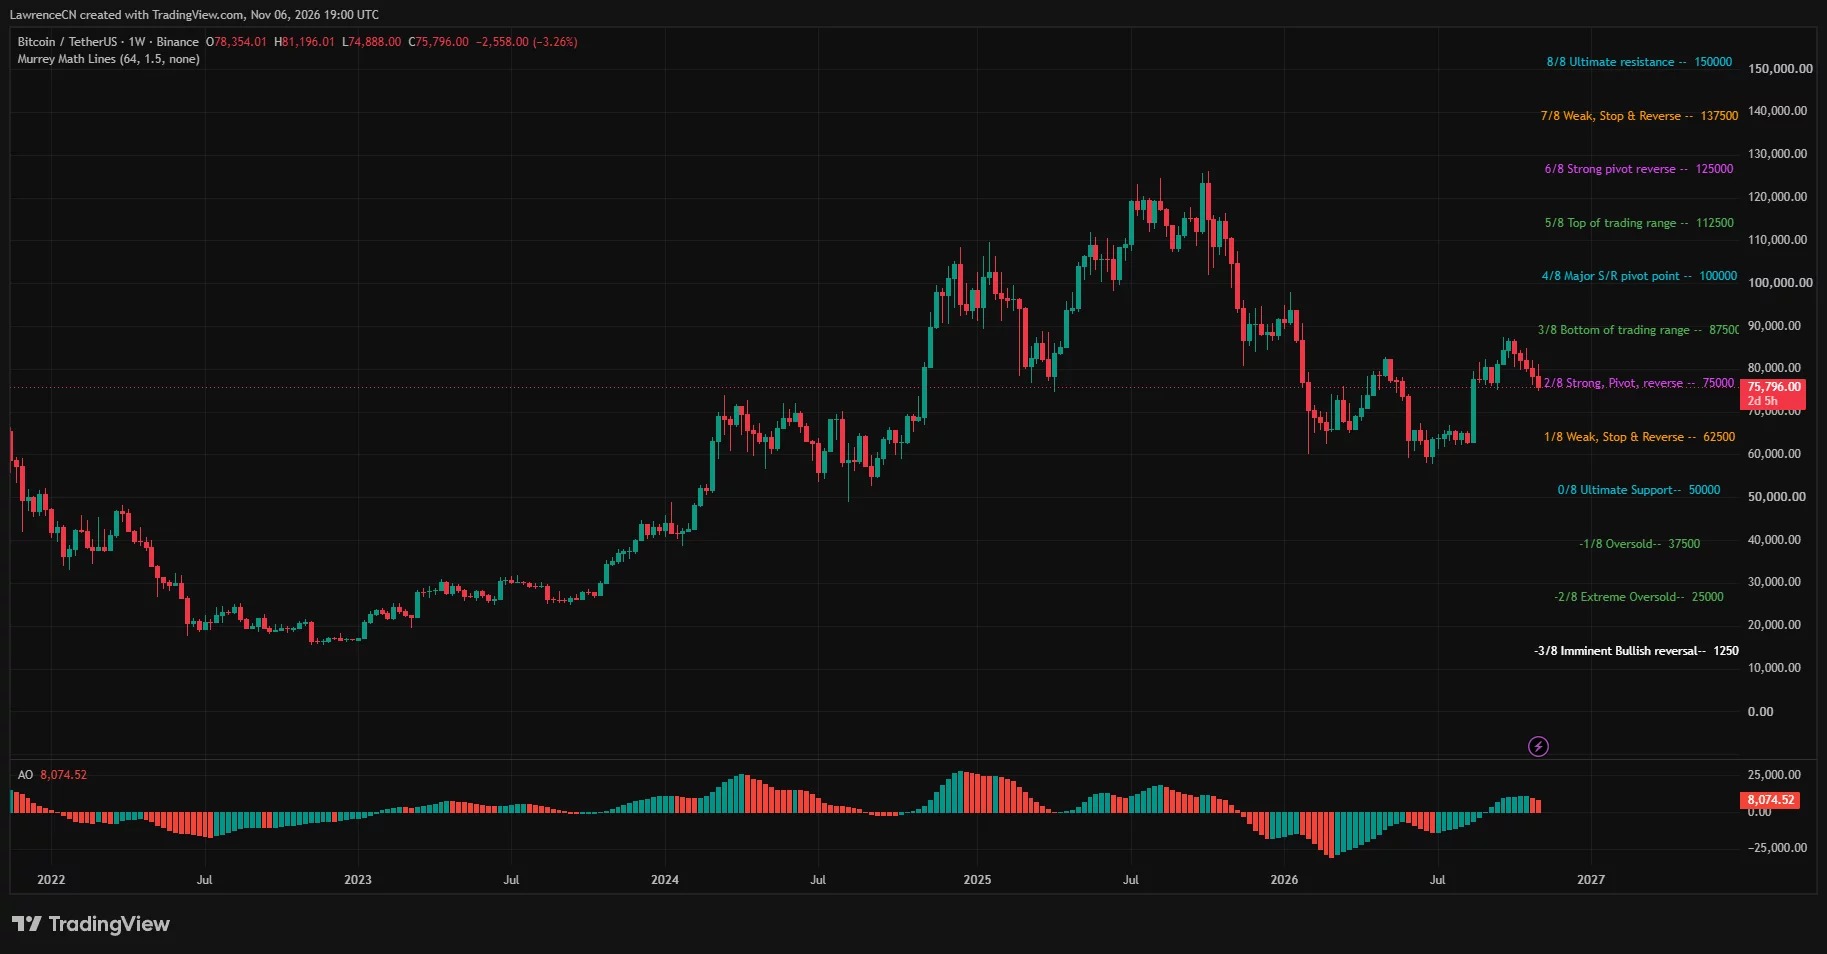
The weekly chart shows that the price briefly fell below the pivot point of $75,000, before buying pressure pulled it back up again.
Liquidation-intensive areas appear above $76,000 and below $75,000, with leveraged positions facing risks in both directions.
Ted Pillows indicates that there is buying interest in the range of $73,000 to $75,000, while Crypto Patel shows a scenario of a deeper pullback.
According to the daily chart, as of November 6th at the time of publication, Bitcoin was trading at $75,798.85, down 0.4% for the day. The price range was between $74,888 and $76,416.24, which indicates that even after rebounding from the intraday low, it has not managed to regain the level of $76,000 again.
Earlier in the day, Bitcoin briefly returned above $76,000 after a sell-off on Thursday. By the evening, the price had fallen back below that level again, and the market continued to watch whether buying interest around $75,000 could support a more sustained rebound.
Bitcoin needs to regain its daily average line.
On the daily chart, Bitcoin is still below the middle band of the Bollinger Bands at $79,759.25, with the lower band at $75,085.29 and the upper band at $84,433.20. It is located near the bottom of this range, continuing a series of lower highs since October.
The daily relative strength index is 37.82, which is lower than its average of 40.42. Selling pressure remains stronger than buying pressure, although this reading is still above the usual oversold threshold of 30.
The weekly chart shows that Bitcoin is trading at $75,796, which represents a decrease of 3.26% from the opening price of $78,354.01 at the beginning of the week. Among the weekly candles that have not yet closed, BTC reached a high of $81,196.01 before falling back to $74,888.
Since there are still more than two days left before the end of this weekly candlestick period, it is still uncertain whether the final closing price will be above or below the pivot point at the time of taking the screenshot.
The liquidation-intensive area is centered around the defense line of $75,000.
The 24-hour clearing heat map of CoinGlass shows obvious concentration areas above $76,300 and $76,600, with an even more dense area around $76,900 to $77,100. In the lower part of the market, there is a concentrated distribution near $74,800, as well as in the range of $74,500 to $74,700.
The heat map shows that Bitcoin briefly fell below $75,000 before rebounding. If the price returns to the upper dense area, short positions may face liquidation; if selling pressure breaks through the support level again, it could hit leveraged long positions.
In a post on November 6th, analyst Ted Pillows mentioned that there were a large number of buy orders around the $73,000 to $75,000 range, while the main sell orders were concentrated in the higher range of $81,000 to $82,000.
"The downside space now seems limited, so there might be a wave of upward movement," he wrote.
His order book indicates a bias towards a rebound, but the daily chart still shows that the moving average is below that selling range. Calculated at $75,798.85, a return to $81,000 would require a rise of about 6.9%, while reaching $82,000 would need a rise of approximately 8.2%.
The chart released by Crypto Patel on November 6th shows another trajectory. Its projected trend allows Bitcoin to first fall to around $68,000 before then making a significant rebound. Therefore, this labeling scheme also leaves room for further declines before entering a bullish rebound scenario.
ETF Capital outflows followed closely after the rebound failed.
This support test occurred against the backdrop of renewed capital outflows from the US spot Bitcoin ETF. As previously reported by crypto.news, these funds recorded a net outflow of $430.2 million on November 5th, reversing the previous trading day's net inflow of $74.6 million.
Fidelity’s FBTC led the declines on Thursday, with a net outflow of $199.9 million, followed by BlackRock’s IBIT with $105 million. Previously, on November 4th, the market saw a brief resumption of buying activity, with Fidelity attracting $236.7 million in funds, while BlackRock experienced an outflow of $201.2 million.
Selling off led to a disruption in the capital inflows that had been on the rise since late October. Farside Investors records show that on October 30, there was a net outflow of $643.2 million, which is higher than the total inflow of $440.8 million over the previous four trading days.
From November 2nd to 5th, the total daily net outflow reached 869.8 million US dollars. On November 5th, the grayscale fund GBTC experienced an outflow of 49.9 million US dollars, Franklin Templeton EZBC had an outflow of 32.9 million US dollars, and the HODL sub-fund of VanEck recorded a net outflow of 23.6 million US dollars.