


In the week ending November 11th, Bitcoin fell from near $80,000 to the range of $73,000 to $74,000. Traders were weighing the possibility of a rebound to around $77,500 while also digesting a warning from an analyst that it could fall further to $65,000.
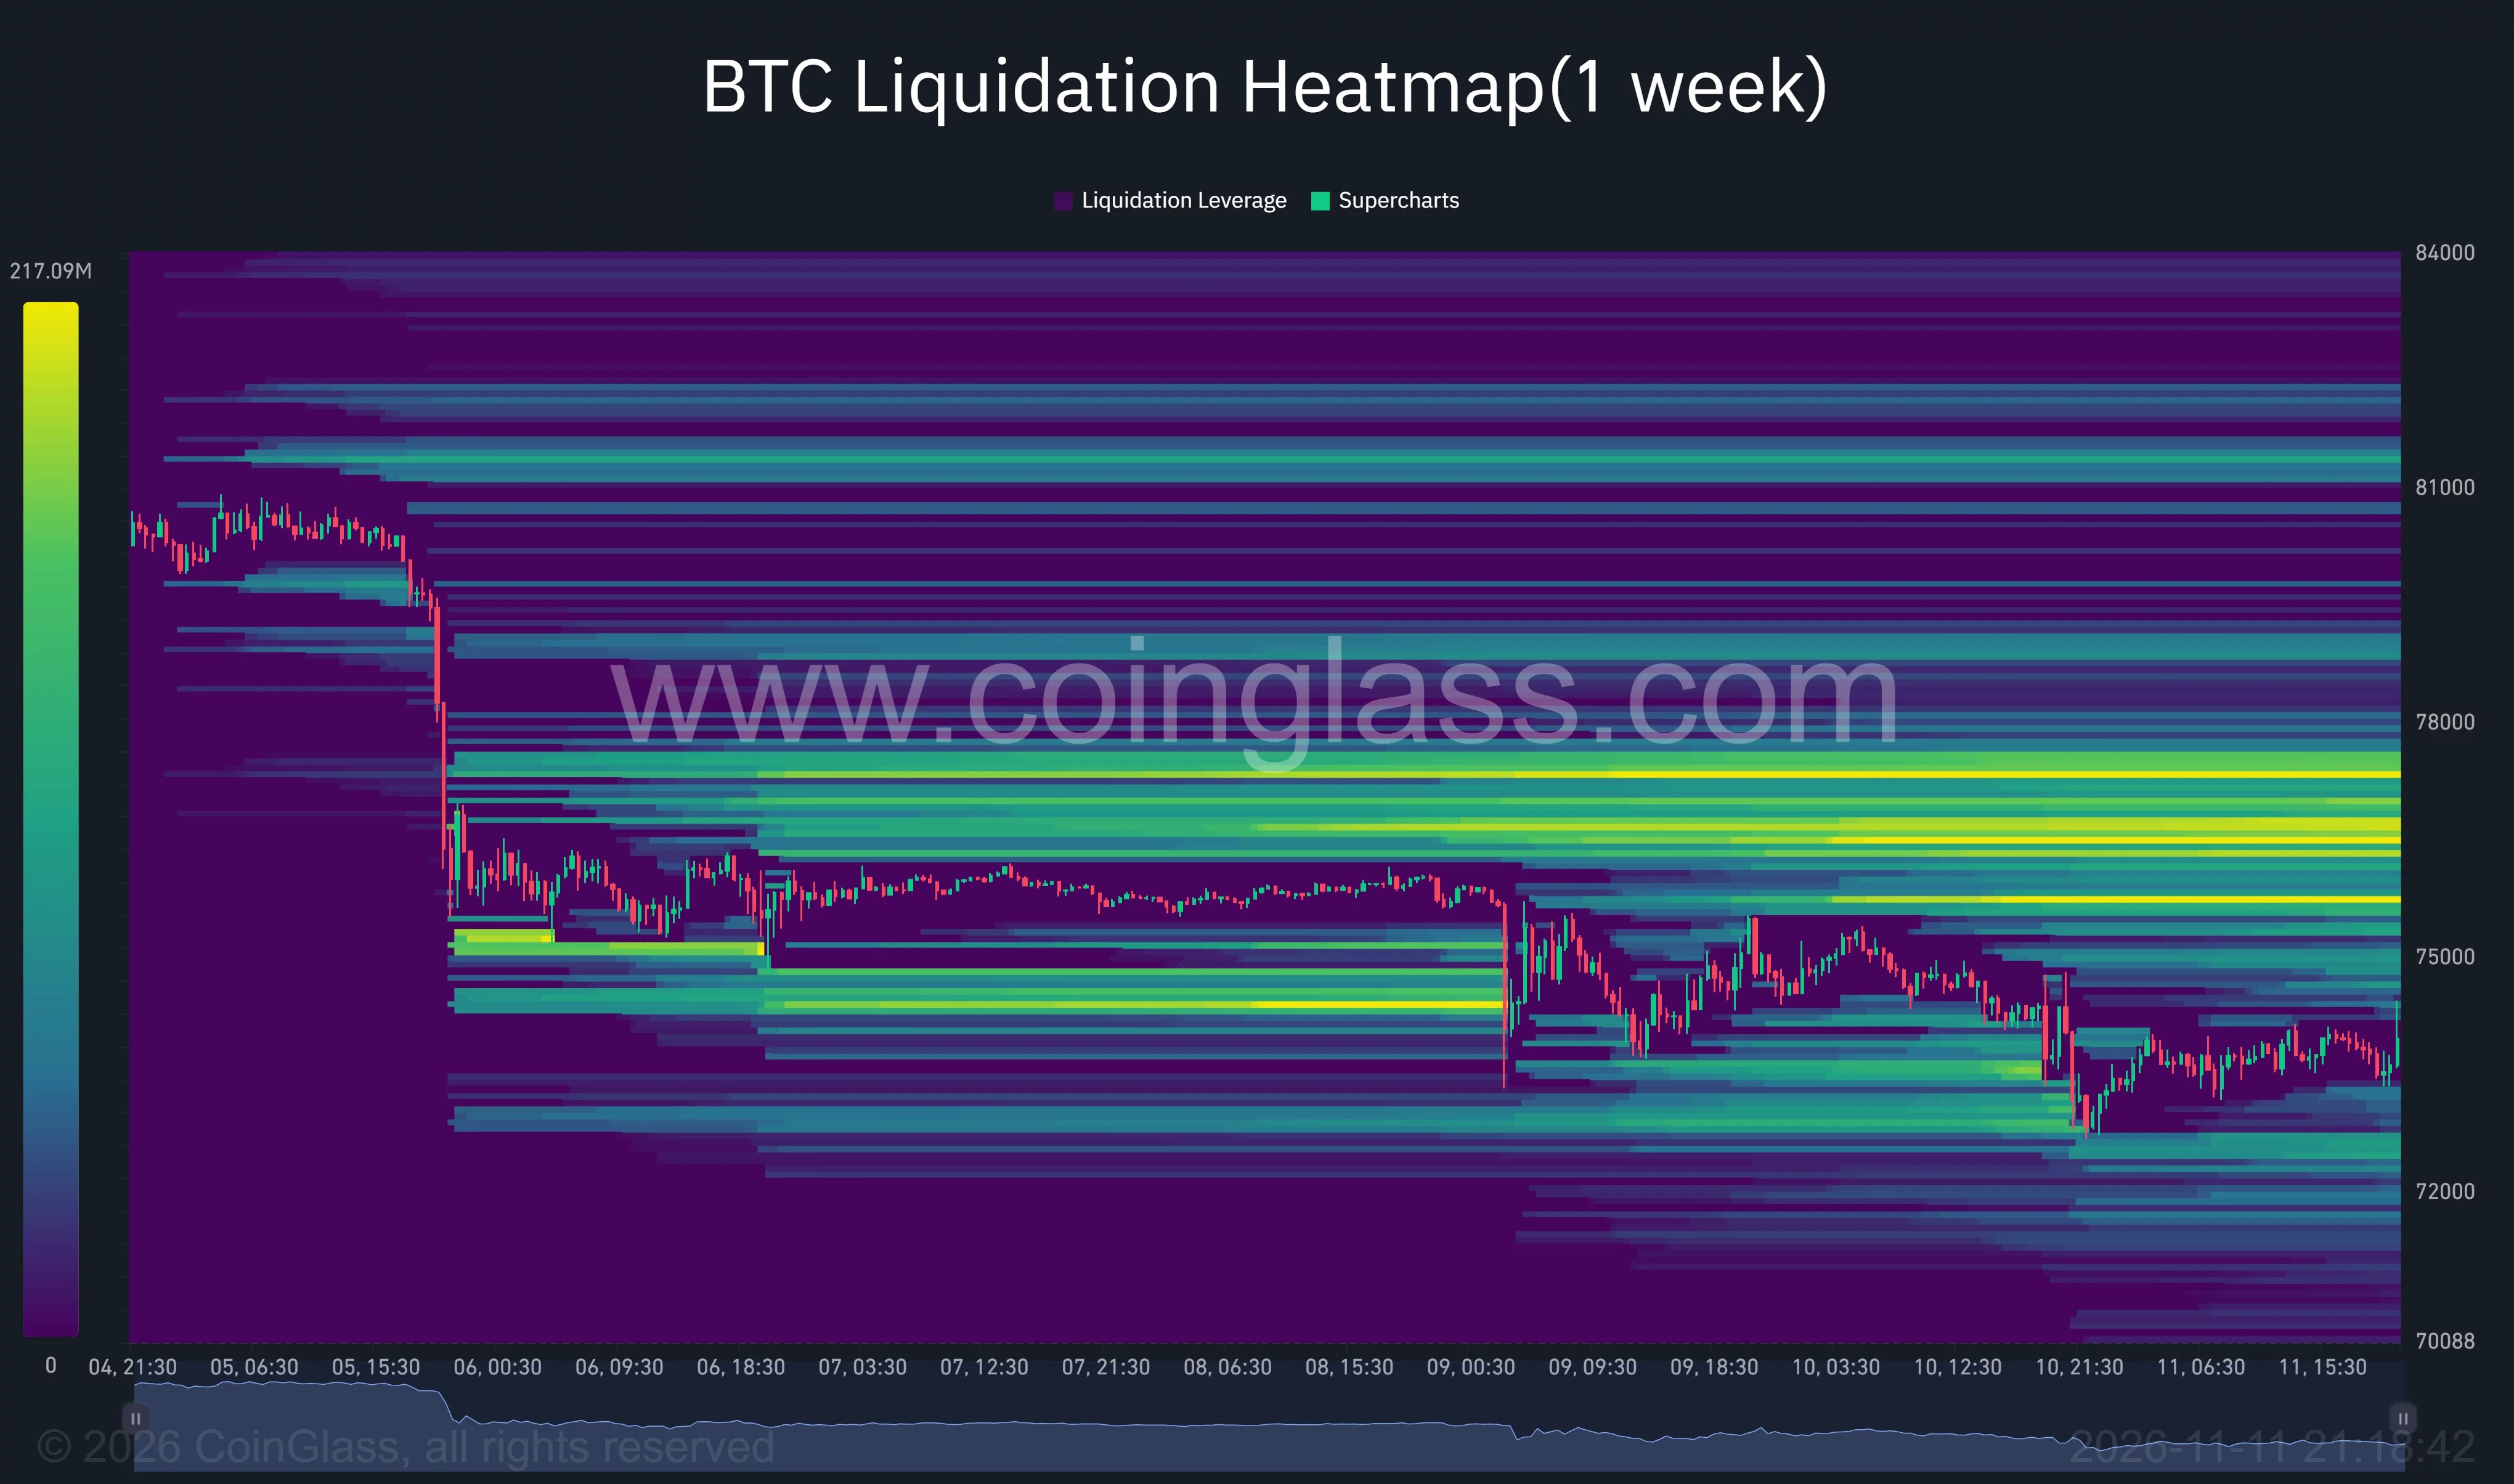
The one-week clearing heat map of CoinGlass shows that Bitcoin was below its previous trading range for most of this period, and several rebounds failed to regain the ground lost during the initial sell-off. By the right edge of the snapshot on November 11th, the trading price of BTC was close to $73,500.
Bitcoin's channel break below brings $65,000 into sight
In a post on X on November 11th, an analyst using the pseudonym Tranquility Crypto (with the account @MstrTranquility) stated that Bitcoin has been trading within a downward channel since September. His chart showed that the price was repeatedly hindered near the upper trendline, before subsequently falling below the lower trendline.
This analyst stated that the market "is expected to move towards $65,000," and indicated that he would only be more confident in determining that a bottom has been formed once the structure that was broken down is re-established.
Calculated using a reference price of $73,500, a drop to $65,000 would represent a further decline of about 11.6%. This target is based on a scenario provided by analysts; the screenshot shows the potential starting point for a break below this level, with the predicted path drawn below the latest K-line.
Earlier technical reports mentioned on November 6th that Bitcoin was near $75,799 at that time, with a relative strength index (RSI) of 37.82 on the daily chart. The weekly chart reached $81,196 before falling back, while the daily price was still below the mid-band of the Bollinger Bands, which is around $79,759.
The liquidation central area leaves room for a rebound of $77,500.
Another layout also emerged in the market. On November 11th, analyst Ted Pillows pointed out on X that there is a significant concentrated area of short-term liquidity between $76,000 and $77,500.
He believes that if the stock market develops a stronger upward momentum, Bitcoin could rebound to this range. The heat map in his accompanying chart highlights the concentrated area above, and the attached one-week CoinGlass chart also shows a bright band-like distribution in roughly the same region.
Calculated at $73,500, a rise to $76,000 would require a 3.4% increase, while a rise to $77,500 would require about a 5.4% increase. Both of these levels are still below the price of Bitcoin near its starting point on the weekly chart.
Despite the slowdown in daily selling pressure, spot Bitcoin ETF in the United States continues to flow out.
According to previous reports by crypto.news, during the trading week from November 2nd to 6th, spot Bitcoin ETF in the United States saw a net outflow of approximately $1.28 billion. BlackRock's IBIT accounted for $1.21 billion of this outflow, while Fidelity's FBTC attracted $93.1 million in capital inflows.
Farside Investors records show that on November 9th, another $201 million of these products flowed out, and on November 10th, an additional $95 million flowed out. In total, $296 million flowed out over those two days, although the total amount on Tuesday was less than half of that on Monday.
According to the data from Farside, the net outflow on Tuesday was approximately 52.7% less than that on Monday. Nevertheless, both trading days still ended with a net outflow; on November 5th, there was an outflow of $430.2 million, and on November 6th, it was $411.9 million.
IBIT saw outflows of $78.2 million on Tuesday, while FBTC had outflows of $36.8 million. Morgan Stanley's MSBT received inflows of $20 million, which partially offset these outflows. Calculated based on the daily totals from November 2nd to 10th, the net outflow was approximately $1.58 billion.
October inflation data adds pressure after previous declines
The U.S. Bureau of Labor Statistics announced on November 10th that consumer prices rose by 0.4% in October, higher than the 0.6% increase in September. Core prices, which exclude food and energy, rose by 0.3% for the third consecutive month.
Housing costs rose by 0.3%, contributing to more than 30% of the overall increase for that month. Food prices increased by 0.5%, and energy prices rose by another 0.7% after a significant increase of 5.2% in September.
At the time this data was released, the initial decline could already be seen on the weekly heat map. Subsequently, market reports cited CoinGlass stating that within a 24-hour statistical period, the total settlement amount in the crypto market reached 723.37 million US dollars, of which approximately 570 million US dollars came from long positions.
Among them, Bitcoin accounted for approximately $203 million in liquidation amounts, including $175 million in long positions and $28 million in short positions.
DisclosureThis article does not constitute investment advice. The content and materials on this page are for educational purposes only.