














It is reported that the proportion of supplies in a loss-making state has exceeded 50%, rising to a 140-day high, and has re-entered a historically significant bottom area.
The bull-bear cycle indicator has fallen to around -0.5, which is significantly higher than the extreme levels at the bottom of the previous cycle.
As the price of Bitcoin approaches $60,000, the futures market has shown signs of overheating for the first time since 2026, with trading volume reaching $82.97 billion.
The bearish signals for Bitcoin are becoming increasingly difficult to ignore, but it is still too early to assert that the market has bottomed out. The proportion of supply in a loss-making state has risen above 50%, the bull-bear cycle indicator has fallen below zero, and futures activity is also sending another warning sign.
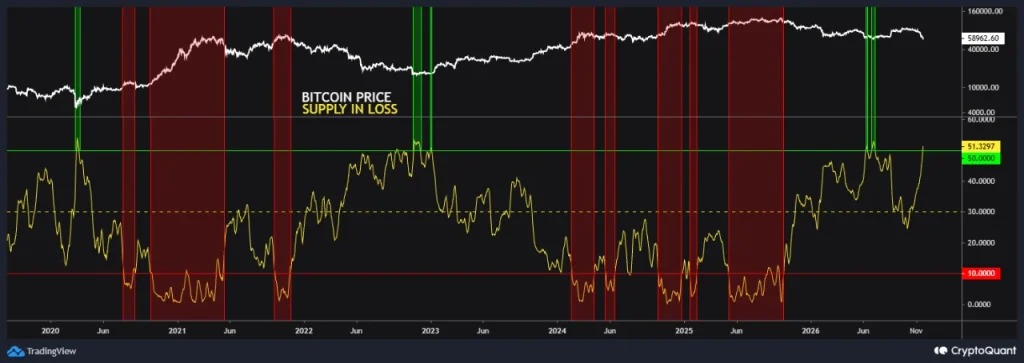
Losses have returned to the historical bottom range.
Analyst Gaah stated that the proportion of losing supply on the 7-day moving average reportedly rose to a 140-day high, returning above 50% again. He described this reading as a return to the historical low range.
Bull-bear indicators are still far from a surrender level.
Analyst R3N has pointed out another warning. The bull-bear cycle indicator has dropped to around -0.5, ending its brief positive phase at the end of summer.
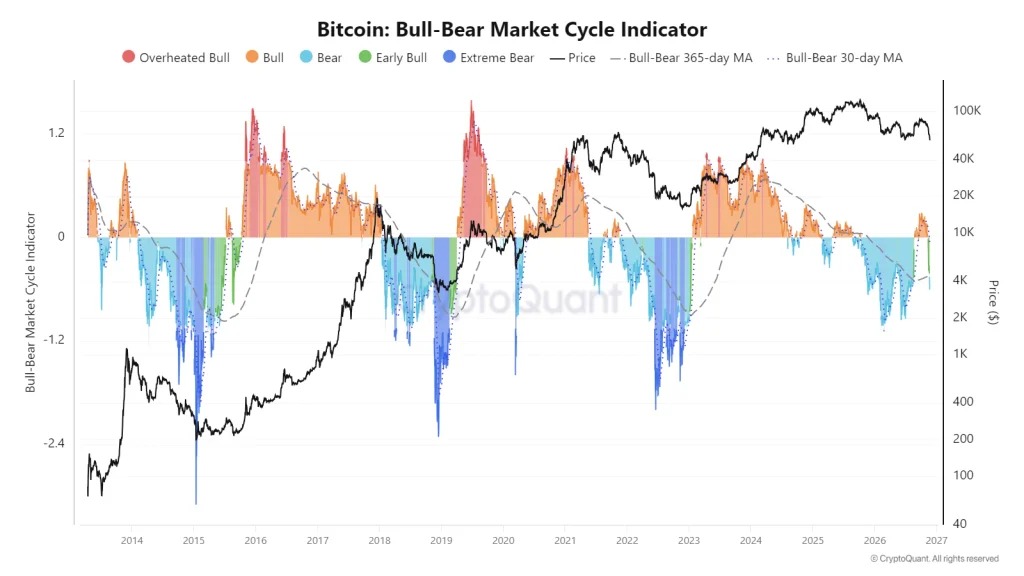
The previous cycle lows were significantly deeper: around -2.4 in 2015, around -1.8 from 2018 to 2019, and around -2.0 in 2022. The low point in the first half of 2026 was around -1.2.
The current reading is low, but it's not yet at a historically low level of surrender.
Futures overheating increases the risk of a double bottom
Analyst Nino reported that on November 20th, there were signs of futures overheating for the first time since 2026. Prices fell to around $58,819, while trading volume reached $82.97 billion.
The appearance of massive trading volumes while prices are weak may indicate distribution or selling pressure. As BTC approaches its summer lows, a double bottom remains a risk rather than a confirmed outcome.
These Bitcoin bottom signals indicate that pressure is accumulating, but at present, they cannot yet be considered as definite reversal signals. However, if the cyclical indicators continue to fall towards -1, it might signify even greater weakness.