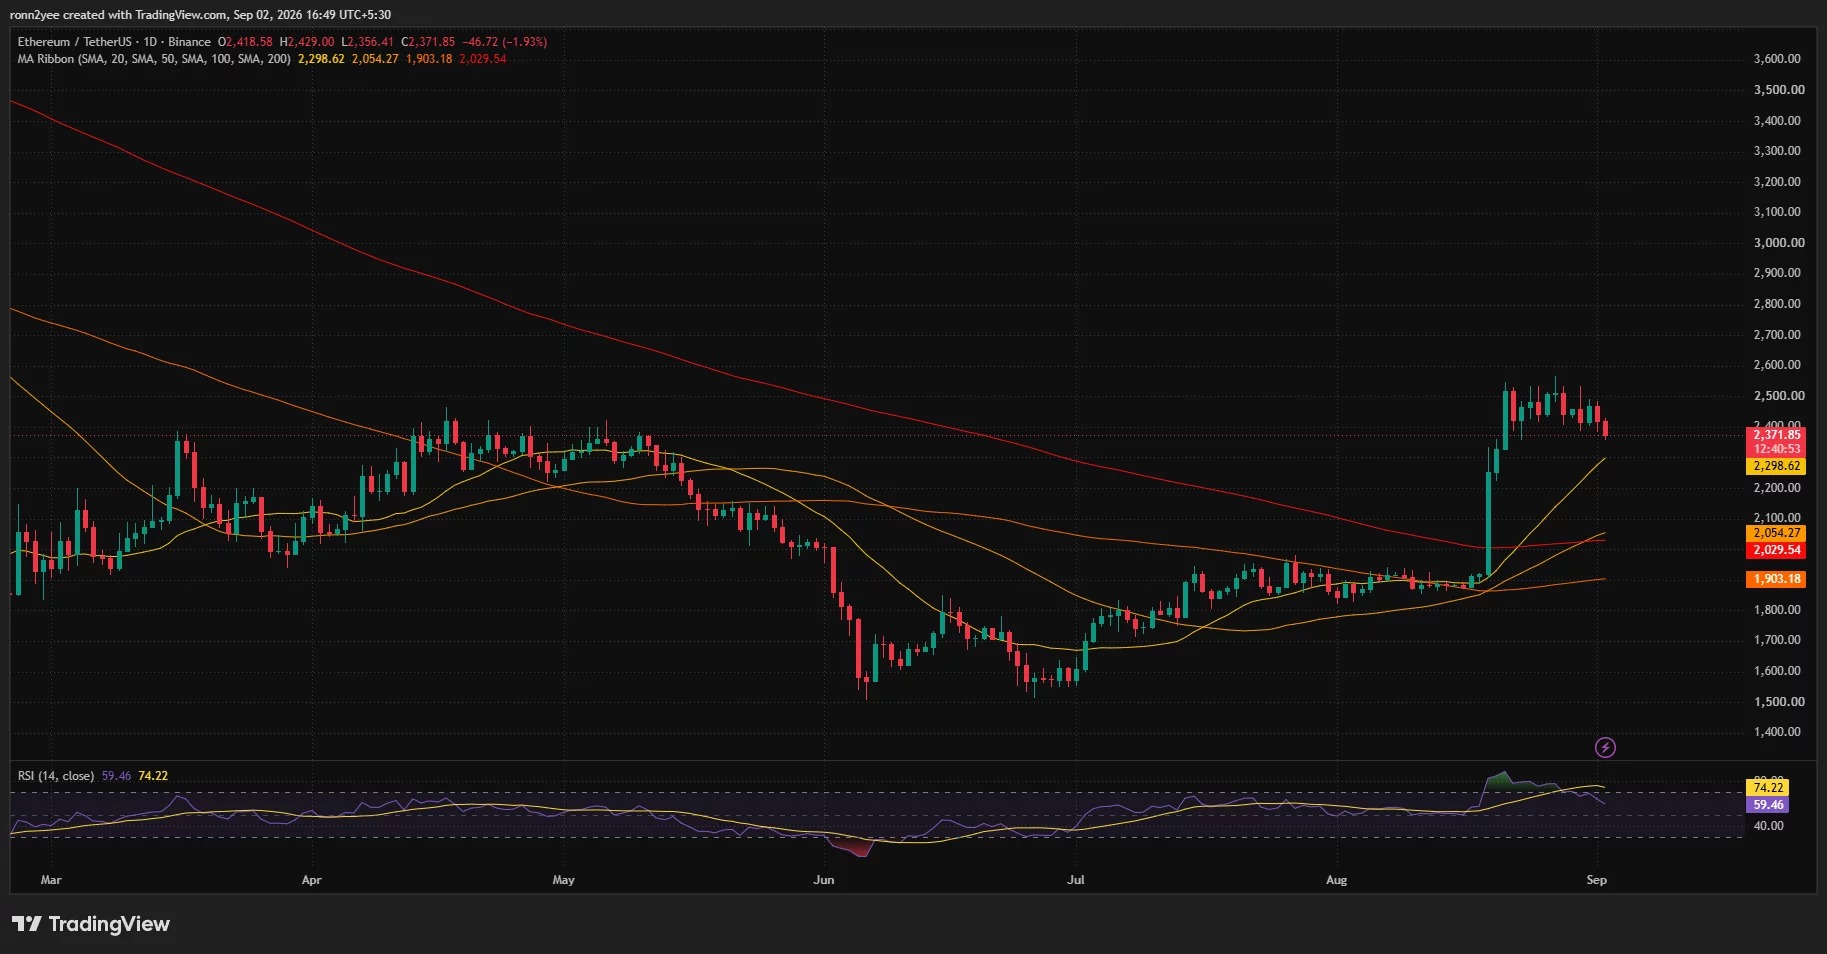


After the renewed escalation of tensions between the United States and Iran, oil prices and U.S. Treasury yields both rose, putting pressure on risk assets. On September 2, Ethereum fell below $2,400, reaching a low of $2,356 at one point during the session, continuing the downward trend since the end of August.
Macroeconomic pressures drag down on risky assets
Brent crude oil once approached $95 per barrel, and markets are concerned that rising energy prices will push inflation upward again, putting pressure on global bond markets. The yield on 10-year U.S. Treasury bonds exceeded 4.8%, reaching a level not seen in nearly three years.
Rising yields typically weaken the attractiveness of crypto assets, as investors can obtain higher returns from government bonds. At the same time, a stronger dollar also puts pressure on ETH denominated in US dollars.
$94.2 million position liquidated
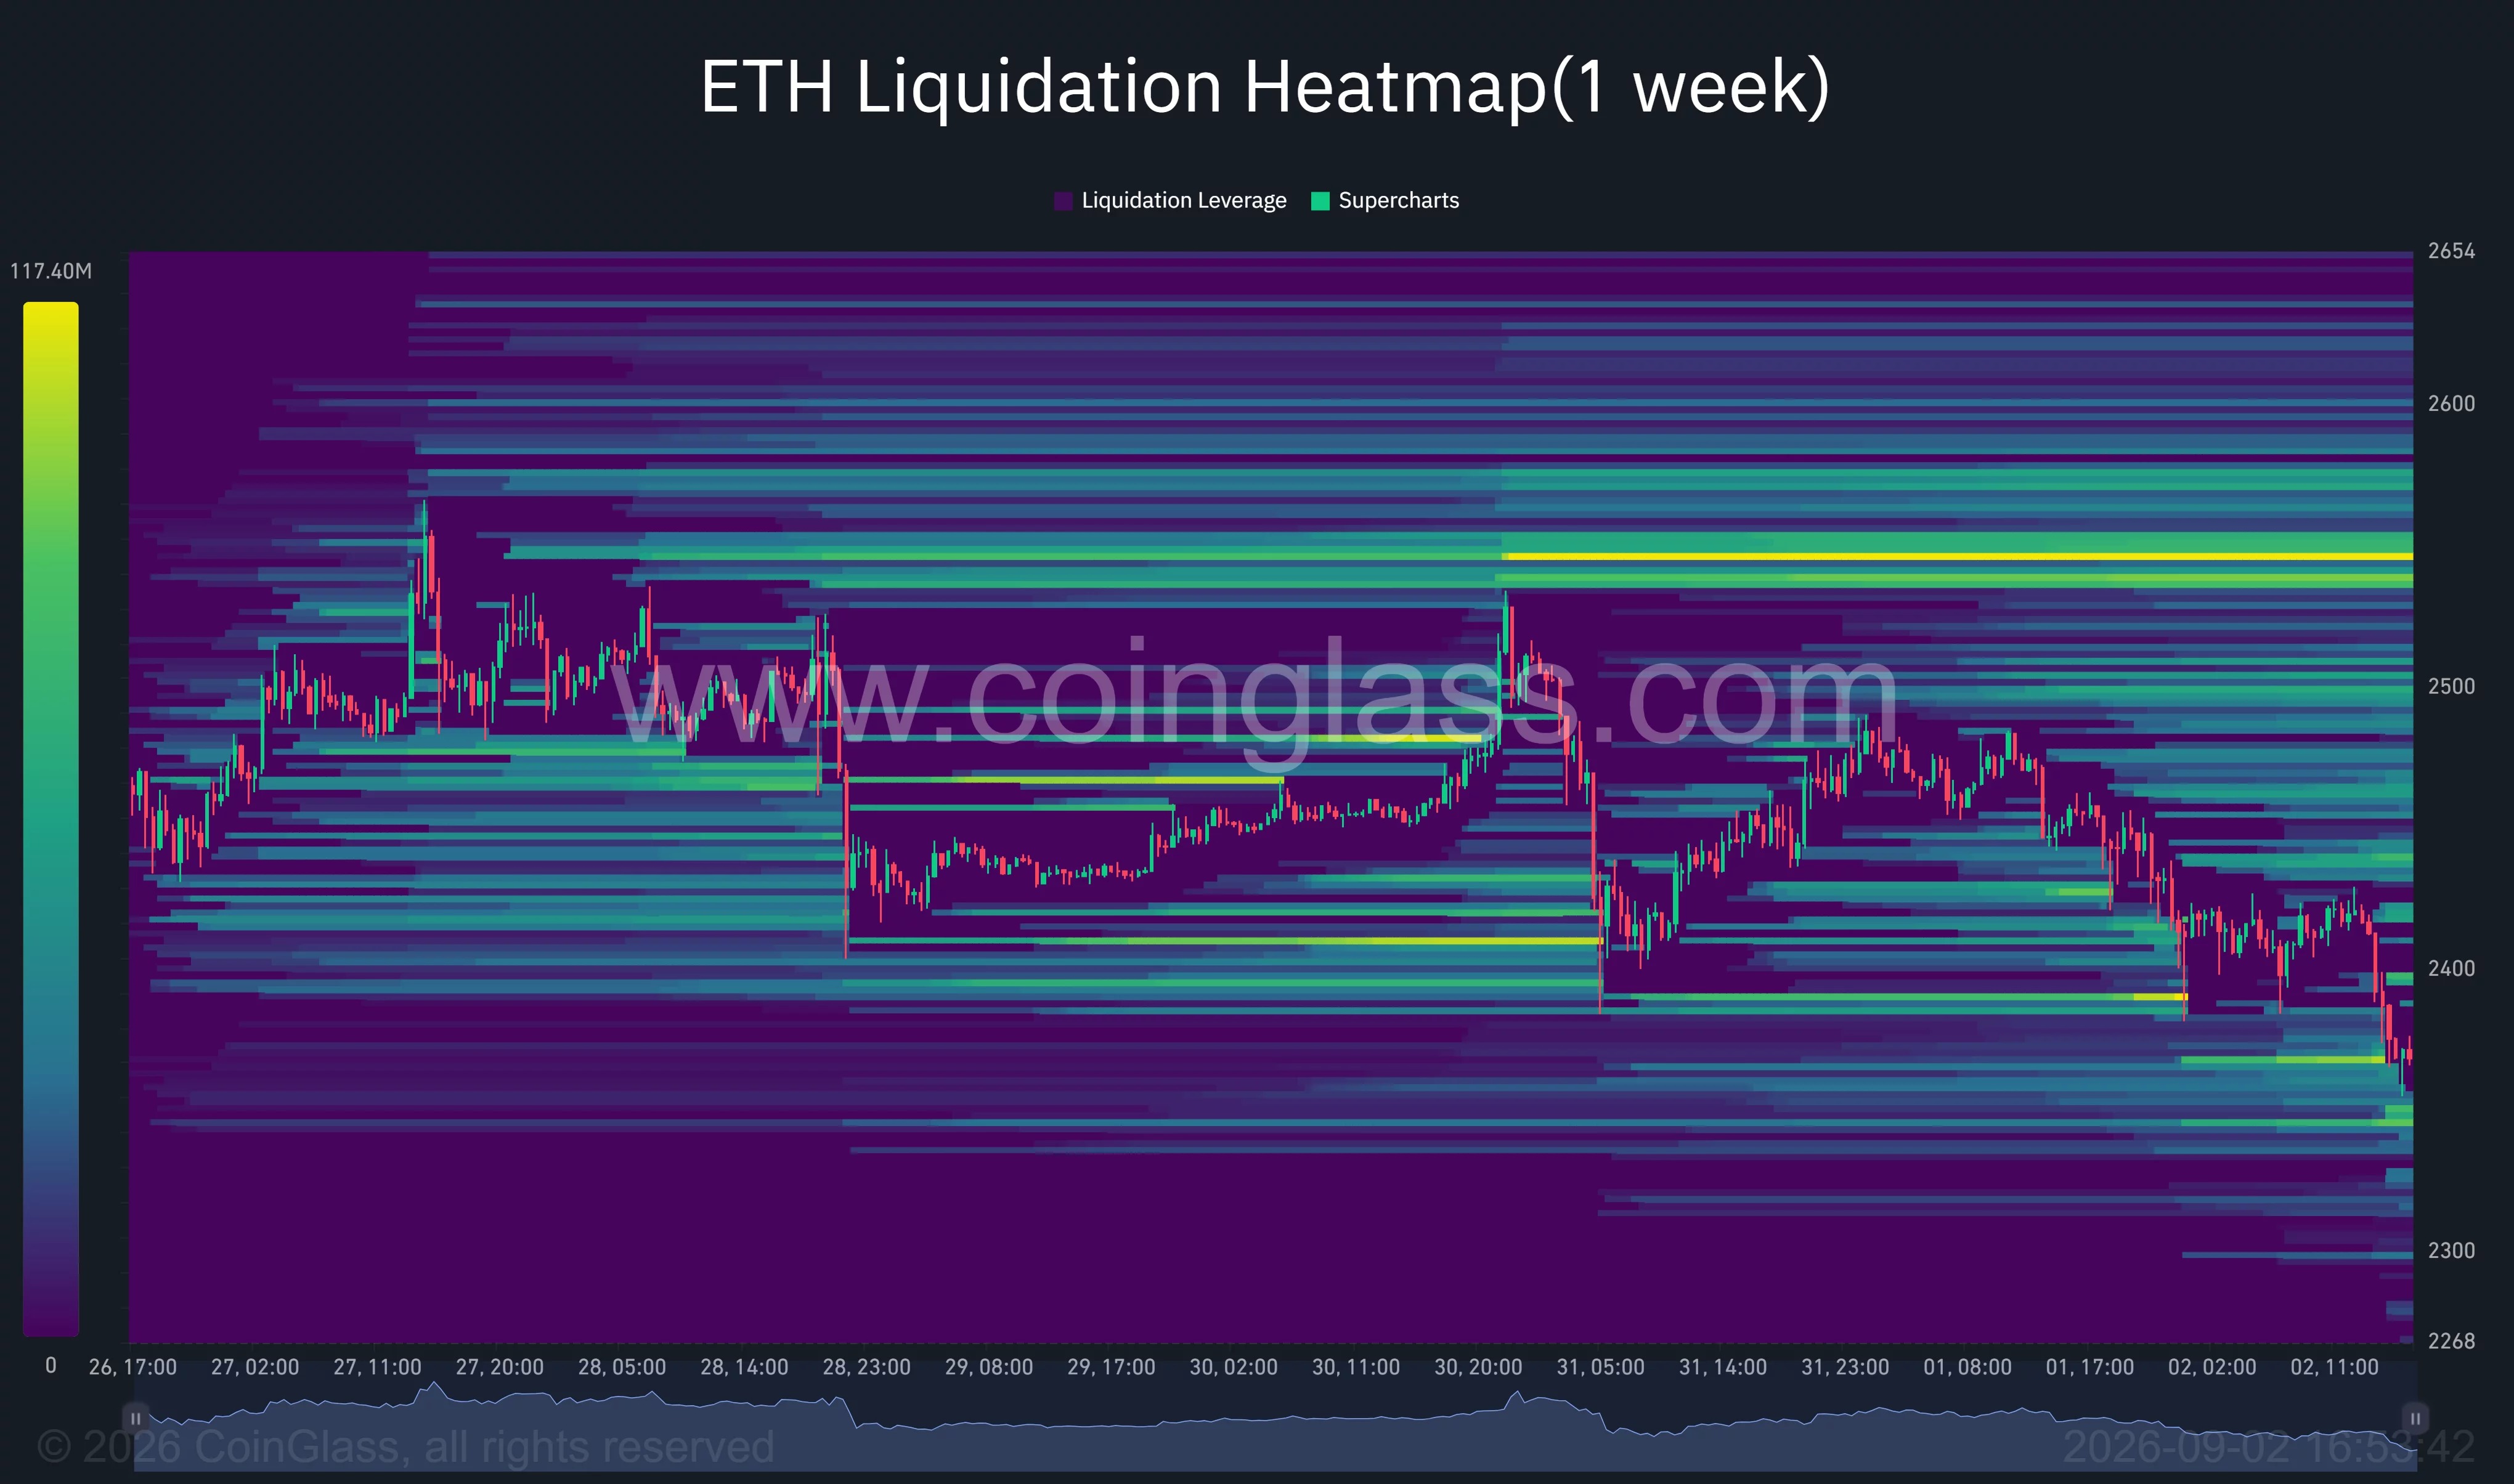
After ETH broke below the short-term support level, volatility in the derivatives market significantly increased. CoinGlass data shows that in the past 24 hours, the liquidation volume of Ethereum futures positions was approximately 94.2 million US dollars.
During the same period, the number of open Ethereum futures contracts was approximately $32.48 billion, and the trading volume of futures was around $54.43 billion, indicating that leveraged funds are still active. The liquidation heat map shows that long positions in the range of $2,400 to $2,360 have been significantly squeezed out.
Around $2,300 serves as a key support level.
From the trend perspective, ETH has fallen by approximately 5.5% from its peak of nearly $2,510 on August 27th to 28th. However, the daily chart is still above the 20-day moving average of $2,299, as well as the 50-day, 100-day, and 200-day moving averages, indicating that the medium-term structure has not yet weakened completely.
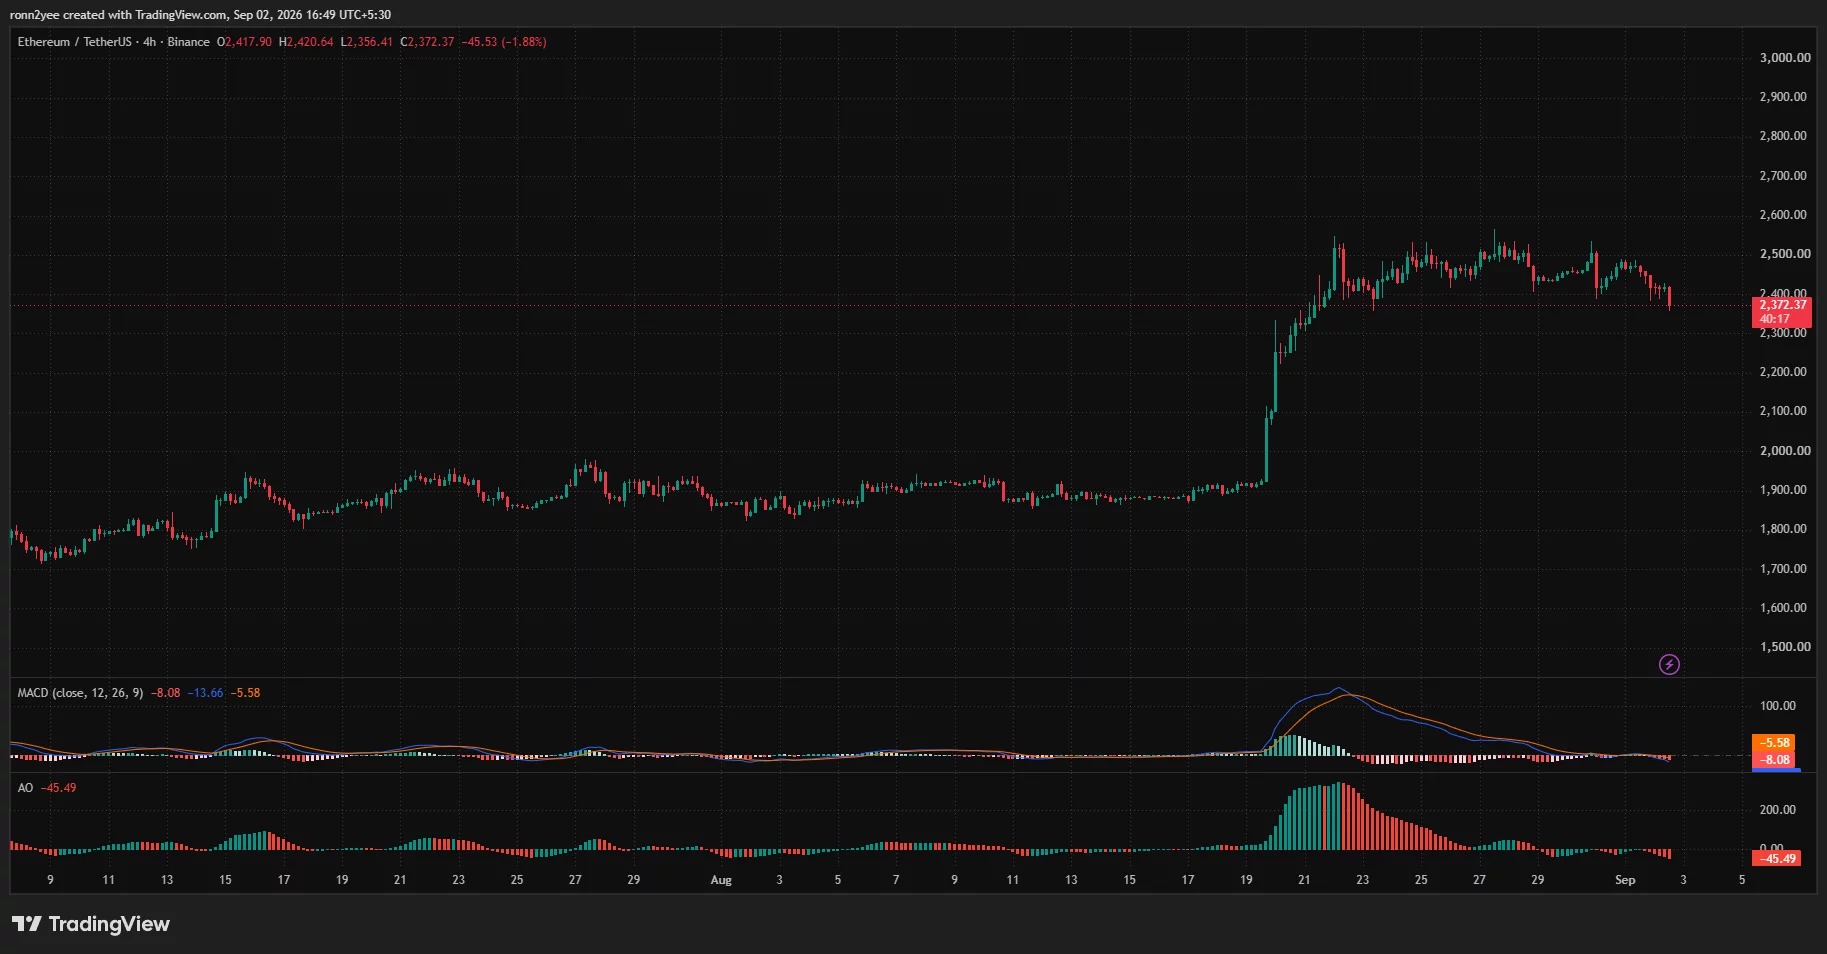
The short-term momentum has clearly cooled down. The daily chart RSI has fallen to 59.46, and both the 4-hour level MACD and Awesome Oscillator have weakened, indicating that sellers are currently in the dominant position. If the daily chart breaks below the $2350 to $2299 range, the price may further test $2200; to alleviate the current pressure, ETH needs to rebound above $2400 first and then re-challenge the $2500 to $2550 range.