






Bitcoin fell below $79,000 on September 8, putting short-term pressure on the market. At the time of this report, BTC was reporting around $78,450, a decrease of about 1% in 24 hours. Previous attempts to break through $80,000 were unsuccessful, with selling pressure mainly concentrated in the range of $81,000 to $82,000.
$795,000 becomes a short-term resistance level
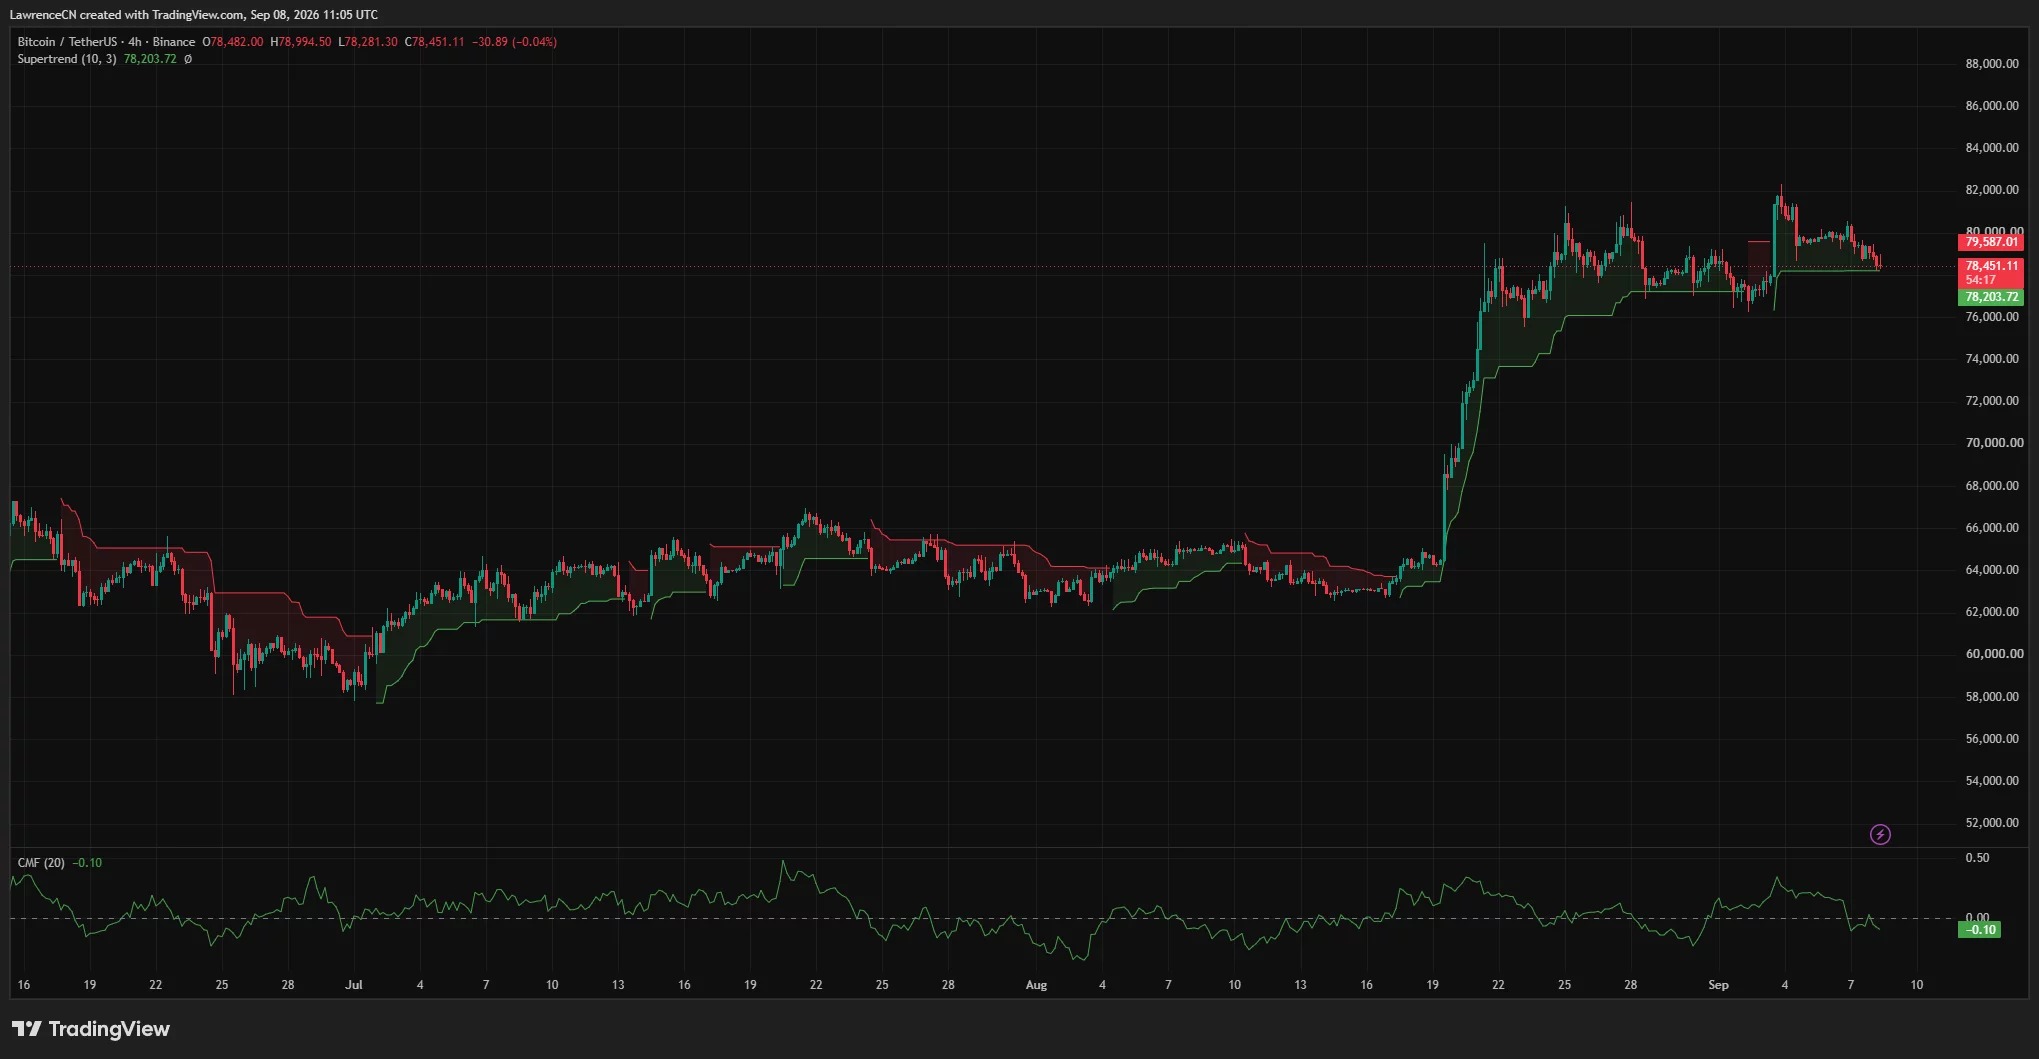
From the performance in the market, BTC once rose to around $78,995, before falling back to around $78,281. On a 4-hour time frame, the price is still slightly above the level of $78,204 for Supertrend, which has become a position that buyers need to hold onto at present.
At the same time, after 4 hours, the Chaikin Money Flow indicator dropped to -0.10, indicating that short-term capital outflows exceeded inflows, and the buying momentum weakened. The previous support level of $79,500 has also turned into resistance, with market attention now focused on whether the level of $78,000 can be held.
Liquidation activity is intensive around $78,000.
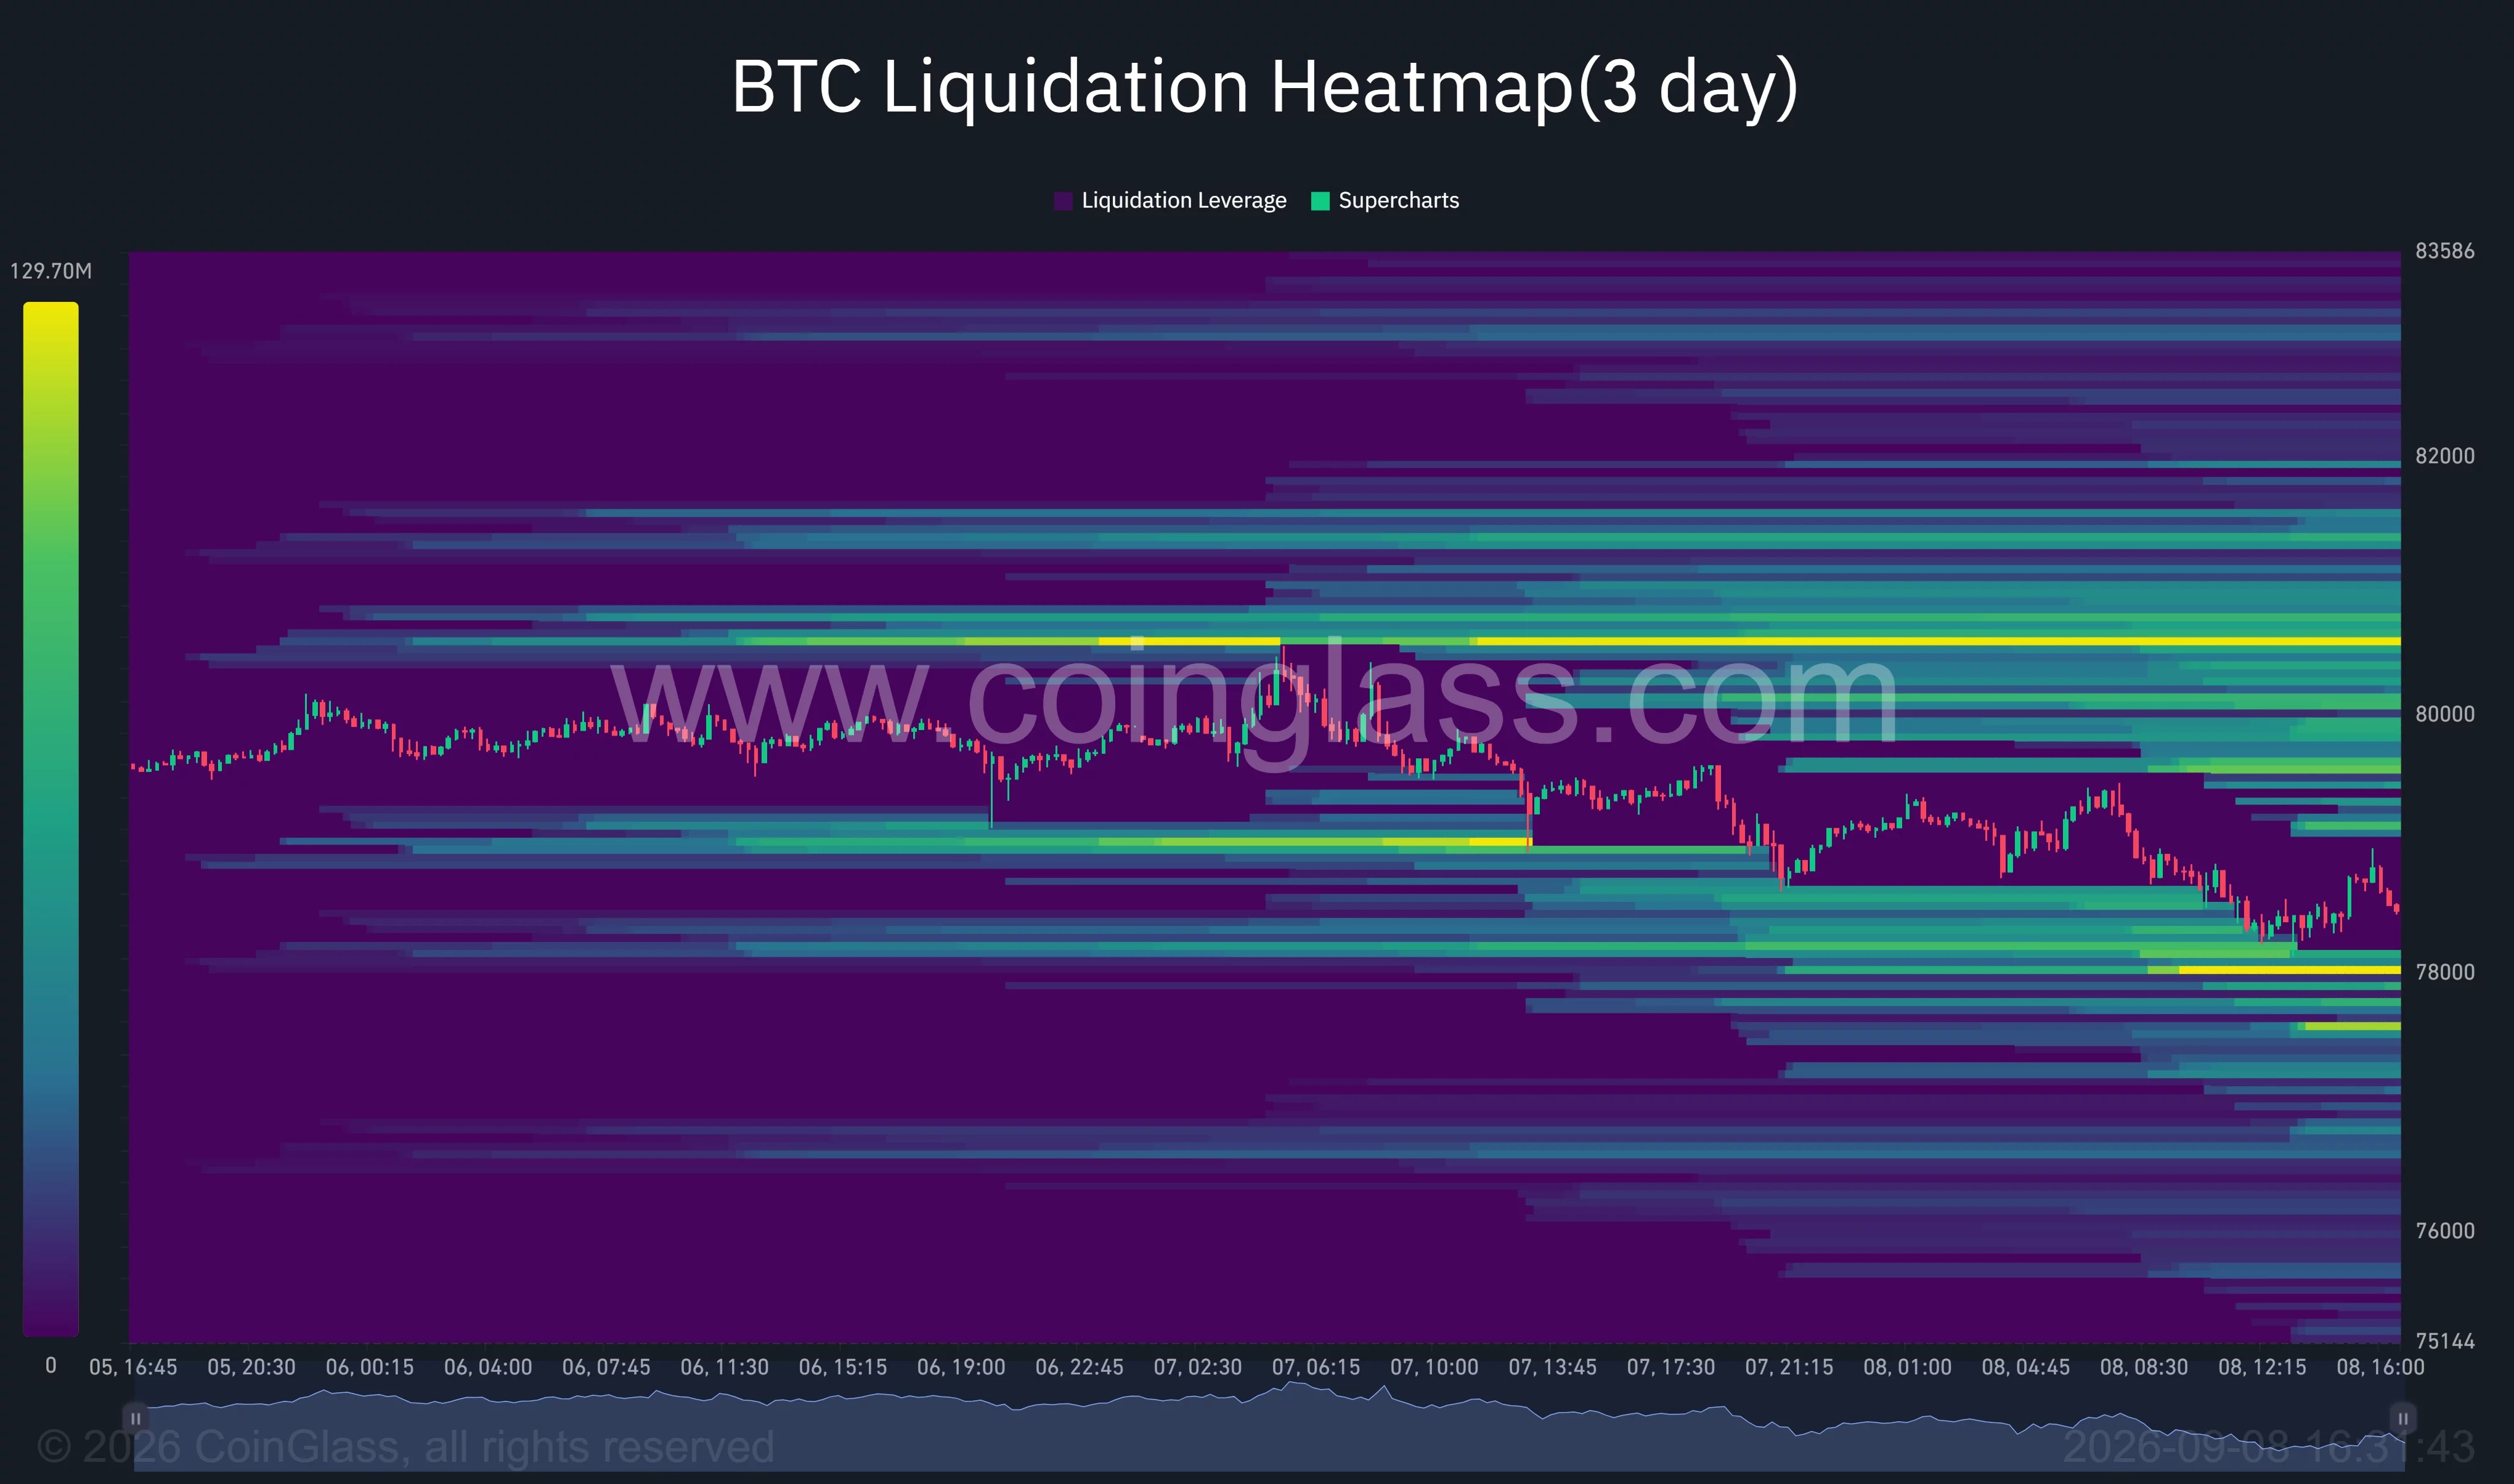
The three-day Bitcoin heat map of CoinGlass shows that there are a significant number of leveraged positions concentrated around $78,000, which is the liquidity area closest to the current price. If the price continues to fall below this area, it may trigger the passive liquidation of some long positions, opening up space below to around $77,500.
If it further weakens, the lower boundary of the recent range at $76,000 will become the next important support level. In comparison, a larger area with concentrated liquidations is located between $80,500 and $80,700, and there is also a noticeable accumulation of liquidity between $81,000 and $82,000.
- Follow-up areas below: $78,000, $77,500, $76,000
- Follow-up area above: $79,500, $80,600, $82,000
This means that Bitcoin is still trapped between the lower bullish clearing zone and the upper bearish clearing zone in the short term. If the price manages to rise above $79,500 again, the market may test the upper liquidity level once more; if it fails to regain this level for a long time, the support at $78,000 will continue to come under pressure.
The daily trend has not yet been broken.
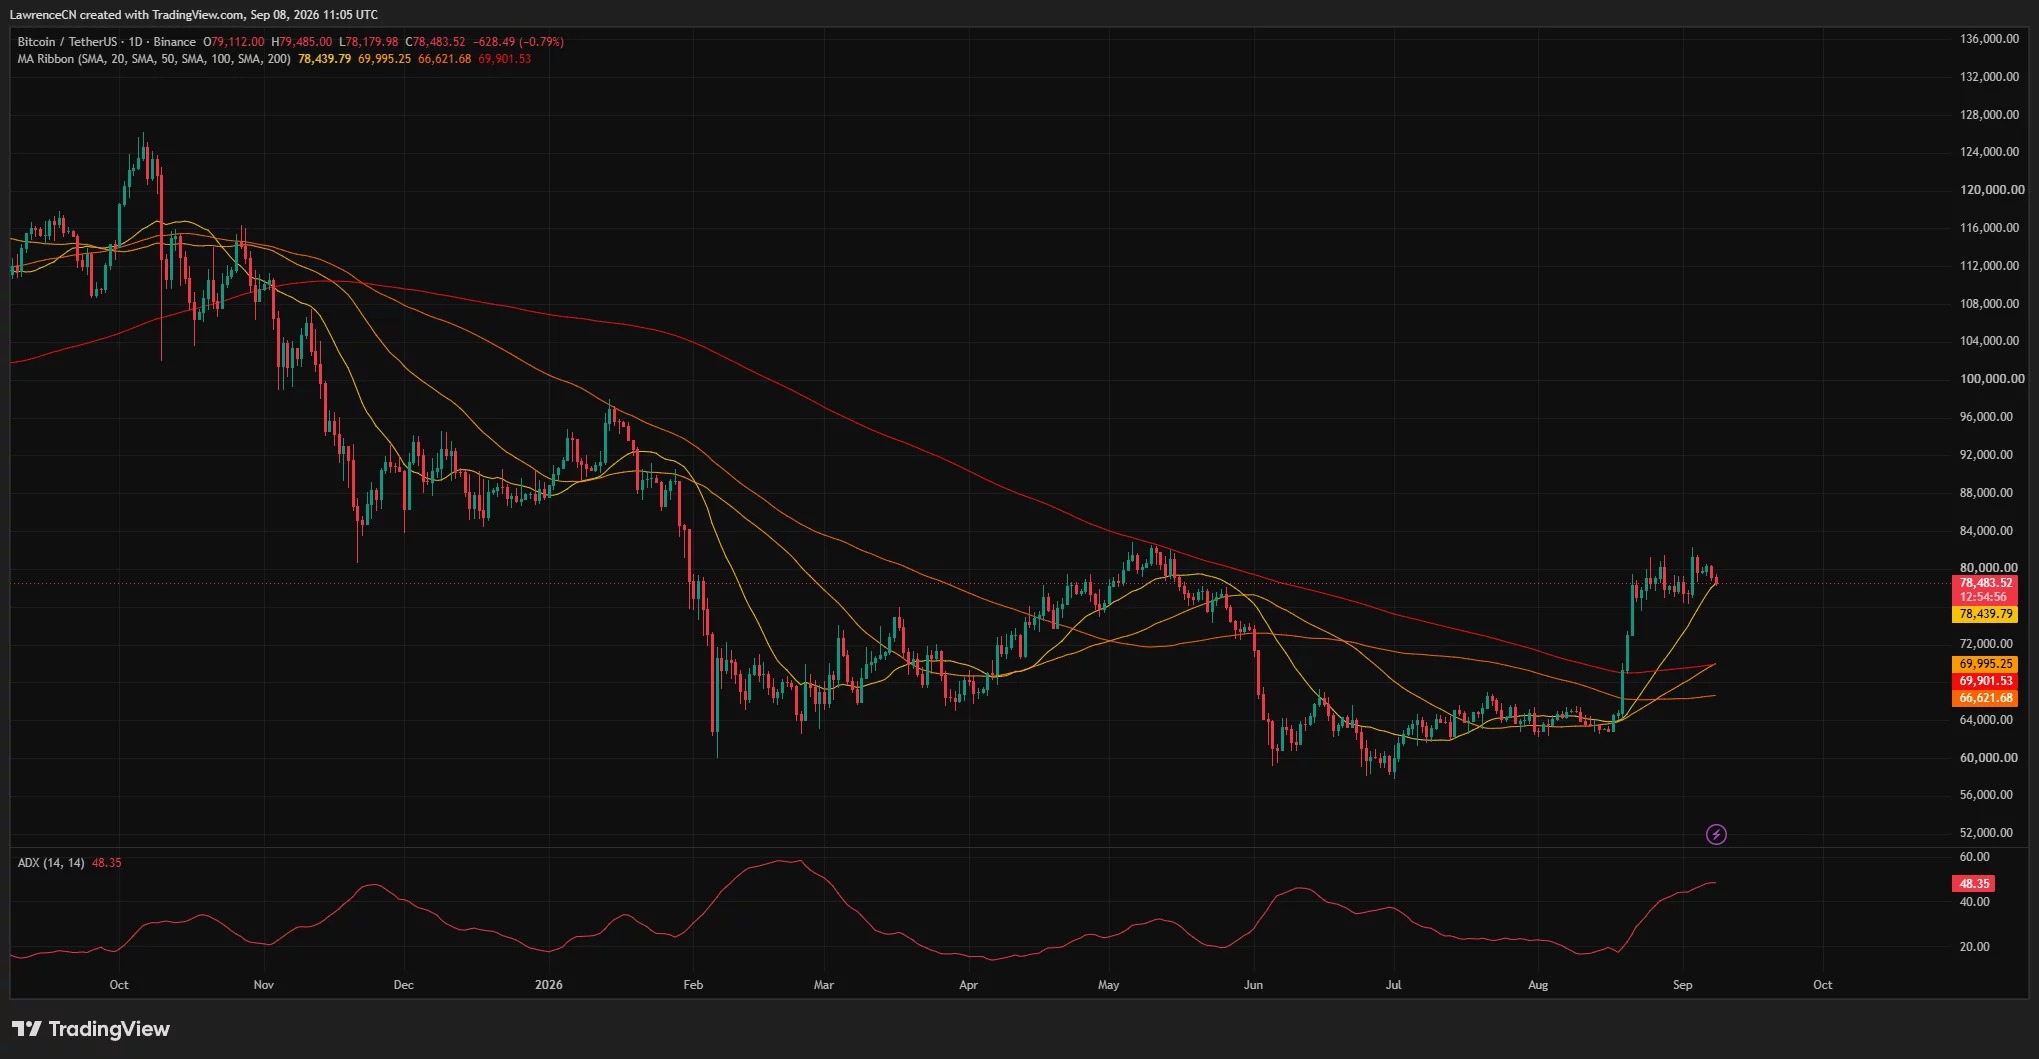
Although there has been a short-term decline, the daily chart structure has not yet shown a clear weakening. BTC is still above the 20-day, 50-day, 100-day, and 200-day moving averages. Among them, the 20-day moving average is around $78,440, which is close to the current price and constitutes the recent dynamic support.
The remaining moving averages are roughly around $69,995, $69,902, and $66,622. The short-term moving averages are still higher than the long-term moving averages, indicating that a larger upward trend structure is still in place. At the same time, the Average Directional Index ADX is at 48.35, reflecting that the current trend strength is still relatively high, but it does not directly indicate the direction of increase or decrease.
Macroeconomic pressures remain before the Fed meeting
At the macro level, the unemployment rate in the United States remains at 4.1%, indicating that the job market still has resilience. For the market, this means that there is still room for the Federal Reserve to maintain a tight stance on interest rates, which may continue to suppress the risk appetite for non-yielding assets such as Bitcoin.
In terms of inflation, the US PCE price index rose by 3.7% year-on-year in July, still above the Federal Reserve's target of 2%. The data for August PCE will be released on September 30, while the Fed's next interest rate meeting is scheduled for September 15 to 16. The correlation between interest rate expectations and the performance of risk assets remains an important variable in the short-term market.