




Bitcoin continued to decline on September 10, falling to $77,688 at one point during the session. Before the release of U.S. inflation data, market risk appetite was weak, and coupled with the high yields on U.S. Treasury bonds, buying activity significantly slowed down.
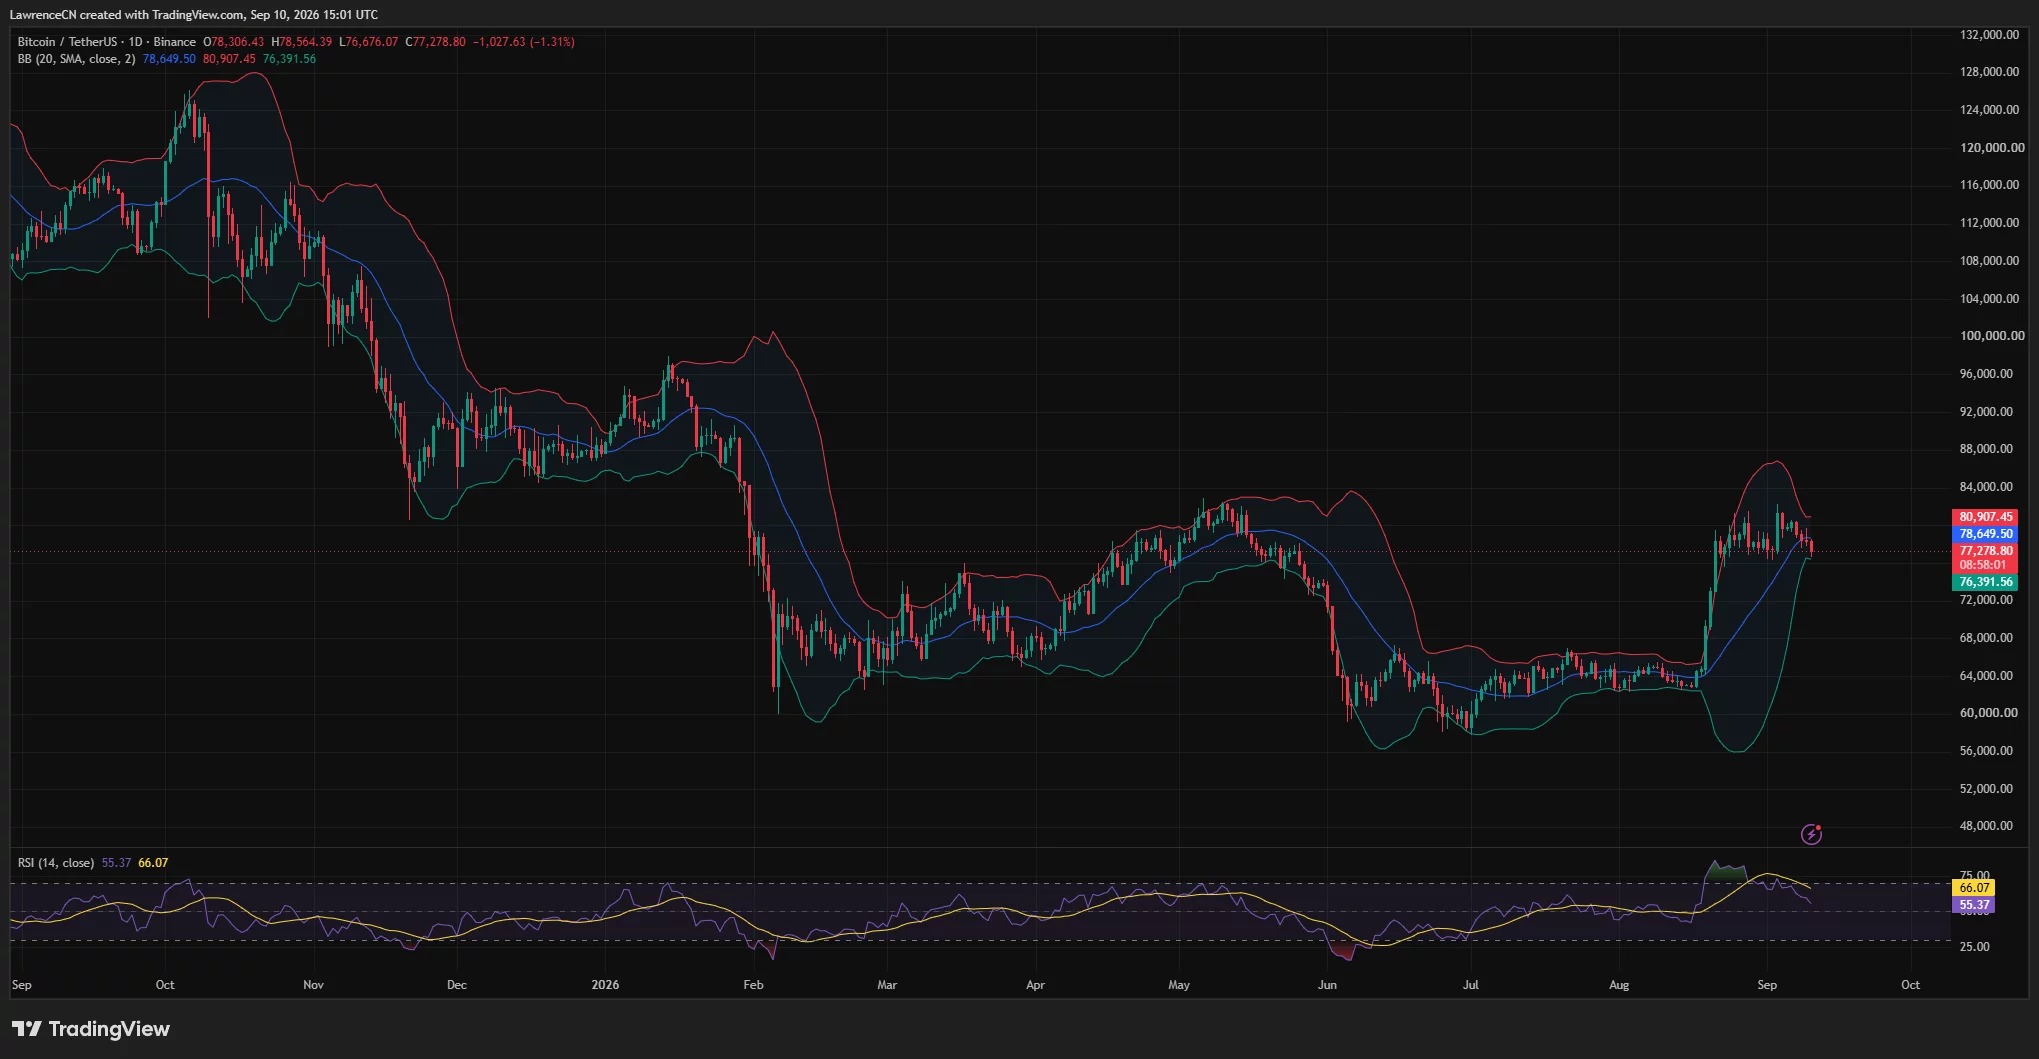
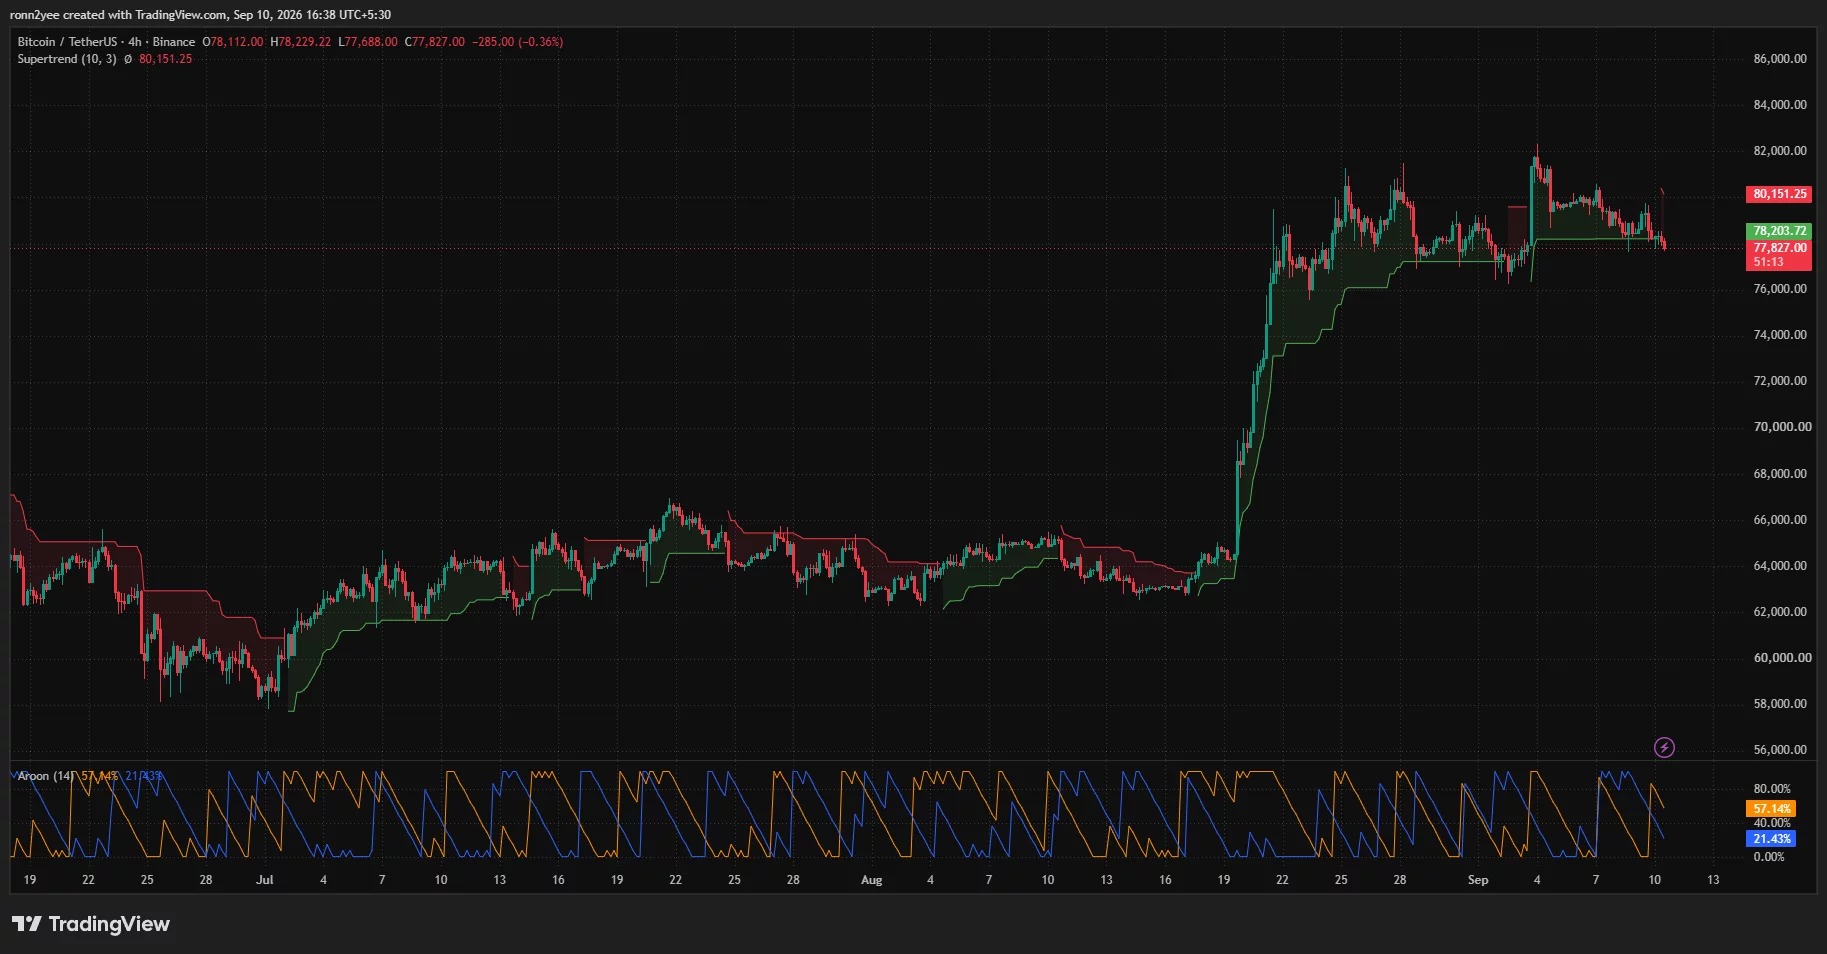
As of around the time of this publication, BTC was trading around $77,800, with a high for the day at $78,564. Since falling back from its peak near $82,280 at the beginning of September, the short-term trend has seen consecutive lower highs, indicating insufficient sustainability in the rebound.
The main range remains between $76,000 and $81,000.
Multiple traders consider the range of $76,000 to $81,000 to be the current main consolidation zone. Over the past three weeks, Bitcoin has experienced several pullbacks of 4% to 6%, but the price has yet to effectively break away from this range.
The short-term resistance first lies around $78,200, with stronger resistance above that at around $80,151. Over the past week, Bitcoin has attempted several times to break through $80,000 but has not been able to hold that level, making this position a key point to watch for whether the rebound can continue.
Inflation and U.S. Treasury yields suppress buying interest
After oil prices returned above $100 per barrel, the market once again worries that energy costs will drive up inflation. If U.S. inflation data is stronger than expected, it may reinforce the Federal Reserve's stance of maintaining tight monetary policy, and even lead to further interest rate hikes.
Meanwhile, U.S. Treasury yields remain high. The yield on 10-year Treasuries is close to 4.86%, and the yield on 30-year Treasuries is close to 5.31%. Against the backdrop of rising returns on fixed-income assets, some funds prefer interest-bearing assets such as bonds, which puts pressure on non-interest-bearing assets like Bitcoin.
Weak spot demand also makes the selling pressure in the derivatives market more likely to amplify price fluctuations. Especially in areas with high clearing activity, passive liquidation of leveraged positions can often exacerbate short-term declines or rebounds.
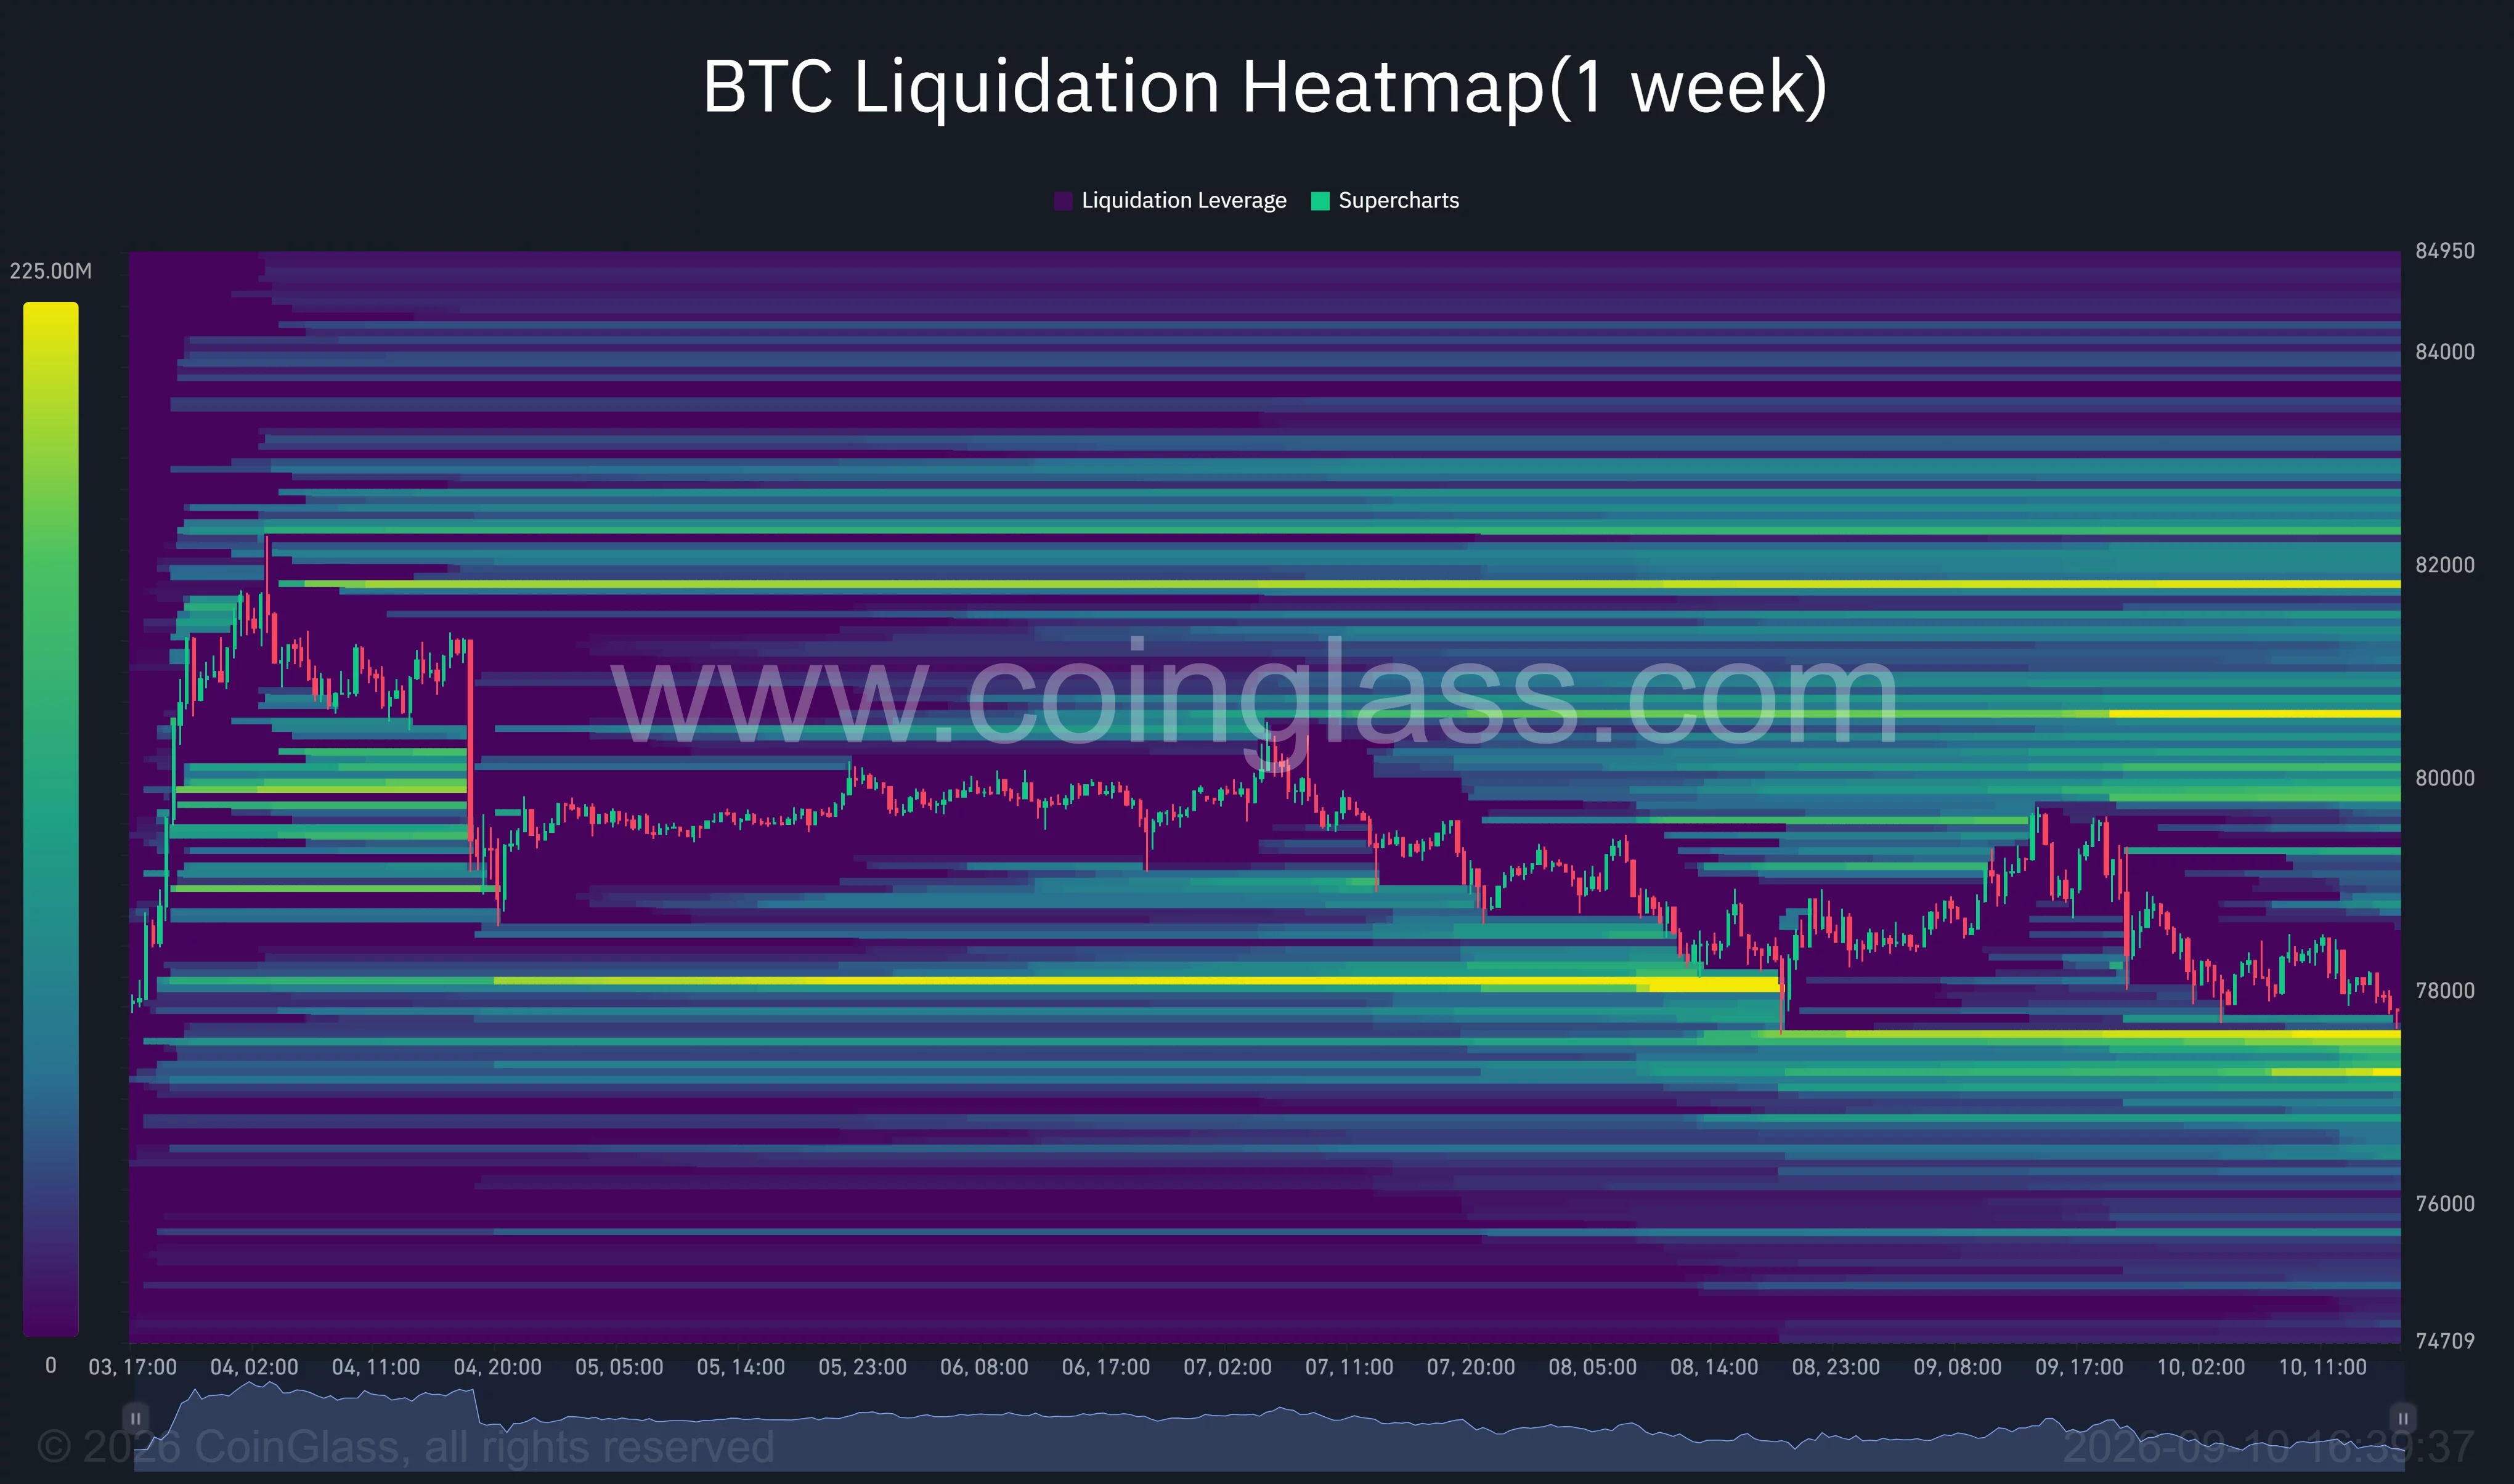
Clearing activity is intensive below $77,300.
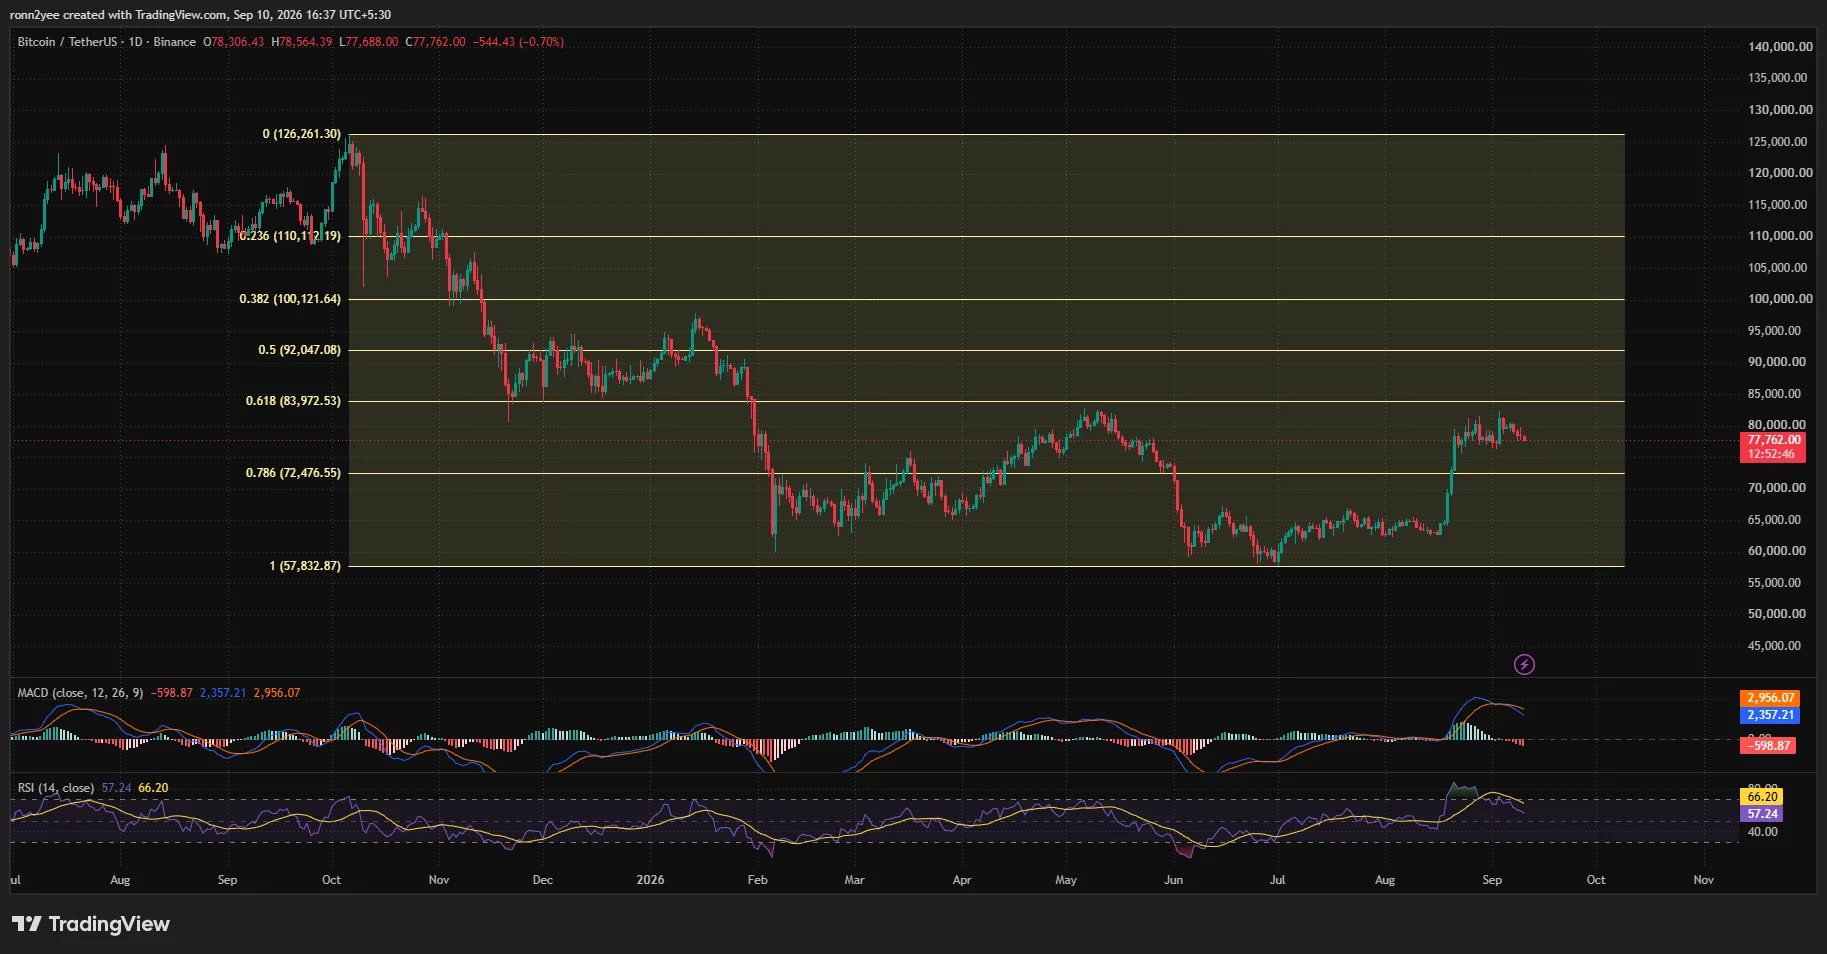
In terms of technical indicators, the daily chart of Bitcoin has shown a death cross for MACD, and RSI has also fallen from its previous higher levels, indicating that the upward momentum is weakening. However, RSI is still above 50, which means that the bulls have not completely lost control.
CoinGlass The weekly clearing heat map shows that the nearest large-scale liquidity area below the current price is between $77,300 and $77,600. If the price continues to fall to this range, it may trigger more long liquidations, but it could also attract some funds to take over at these lower levels.
Above the price level, there are two distinct short-selling liquidation zones, located around $80,500 and $81,800 respectively. If Bitcoin manages to regain above $80,000, short sellers covering their positions could drive prices to accelerate towards these areas.
If the range of $76,000 to $77,000 is lost, the next important support level on the daily chart is around $72,477. What the market is more concerned about next is whether Bitcoin can quickly break away from the fluctuating range of $76,000 to $81,000 and establish a clearer direction.