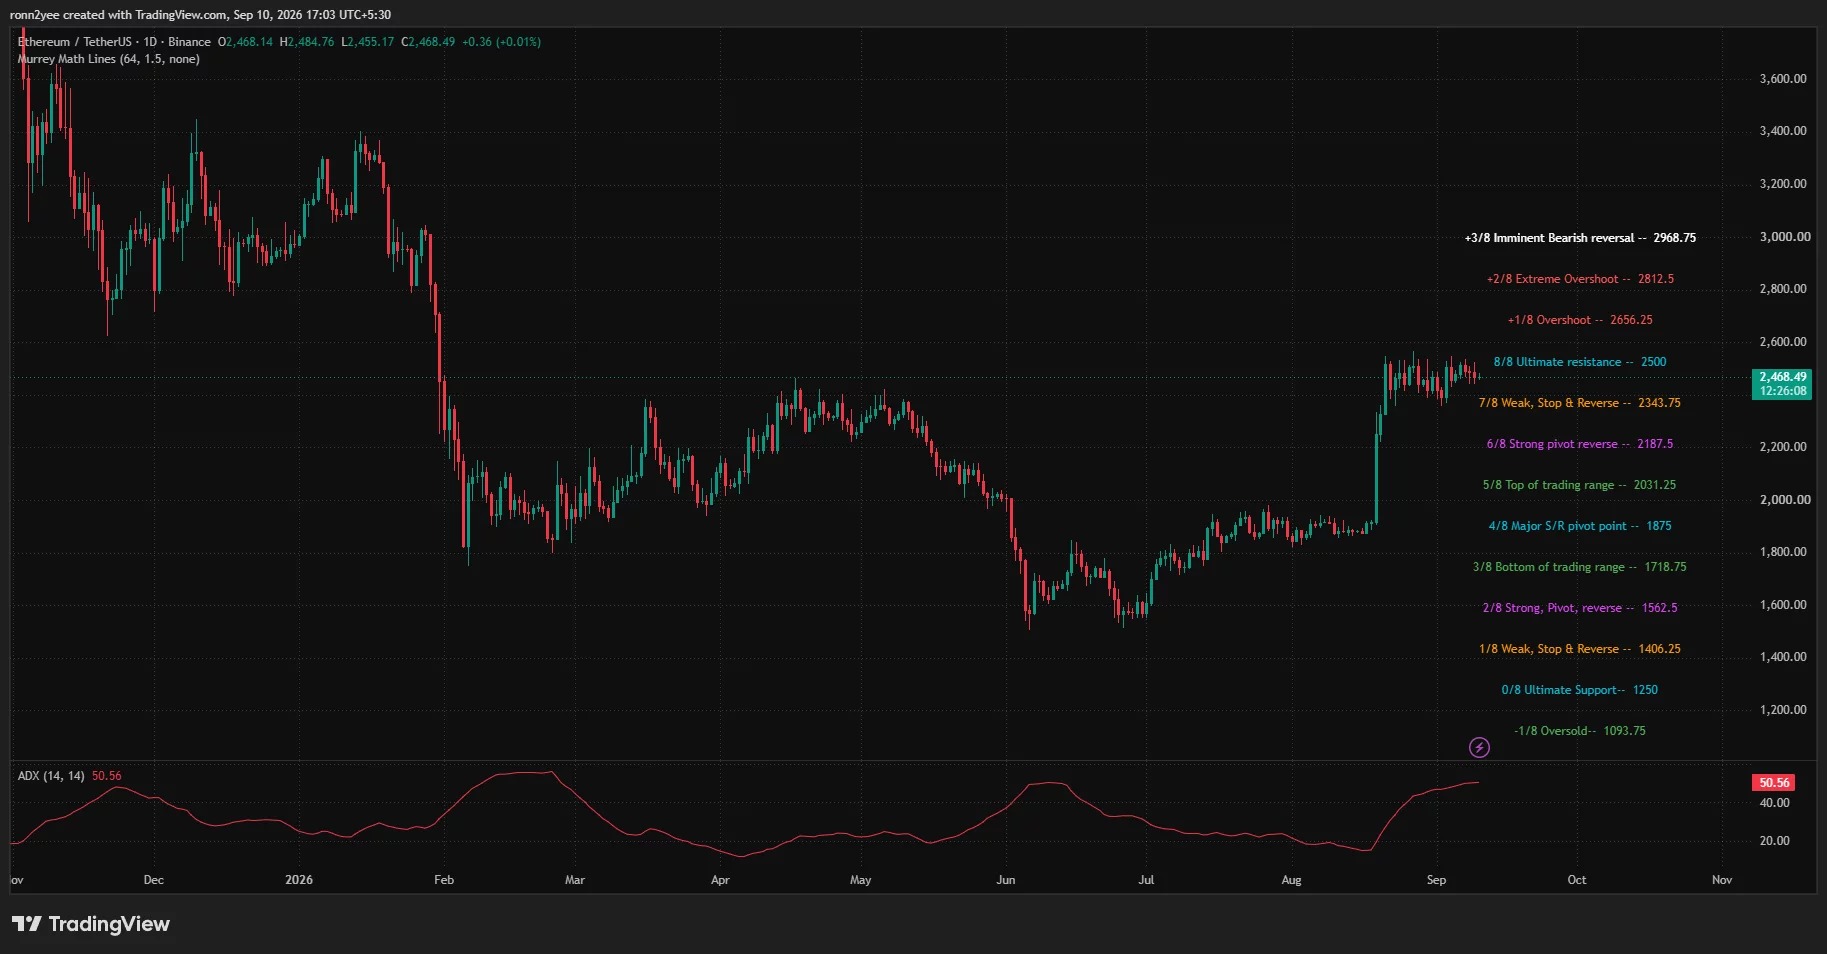





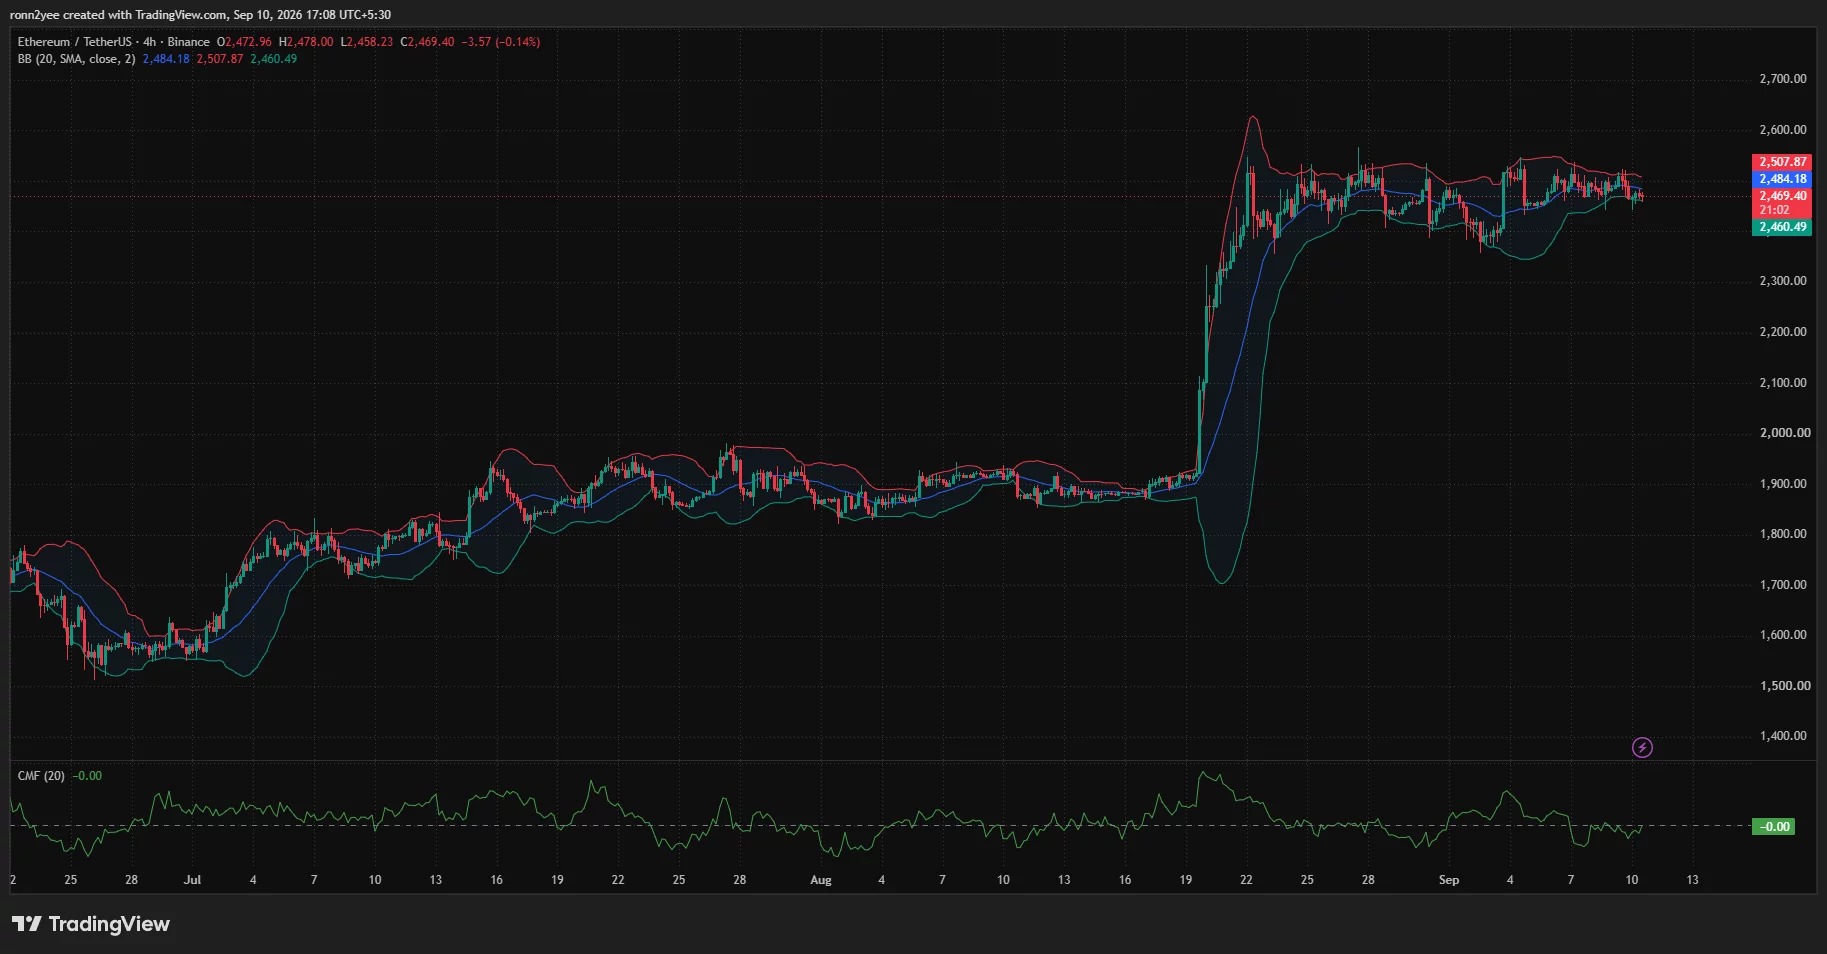
On September 10th, Ethereum remained within a range of around $2,460, briefly falling to around $2,455 during the session before returning back to that range. Over the past few weeks, buyers have managed to support the price at the lower edge of this range on several occasions, but the level of $2,500 has continued to suppress any rebound attempts.
Around $2,460 remains the short-term support level.
From the intraday performance, ETH has been trading roughly between $2455 and $2485, with short-term support levels concentrated around $2460, while resistance lies in the $2500 to $2508 range. After a rapid rise in August, Ethereum managed to maintain its main gains, but further upward momentum has clearly slowed down.
A 4-hour period display shows that the price is still below the middle band of the Bollinger Bands and is moving close to the lower band, indicating that the short-term selling pressure has not completely subsided. If it falls below $2460, the market may test the intraday low near $2445 again; if it manages to rebound above the middle band, the focus will shift back to the resistance zone above $2500.
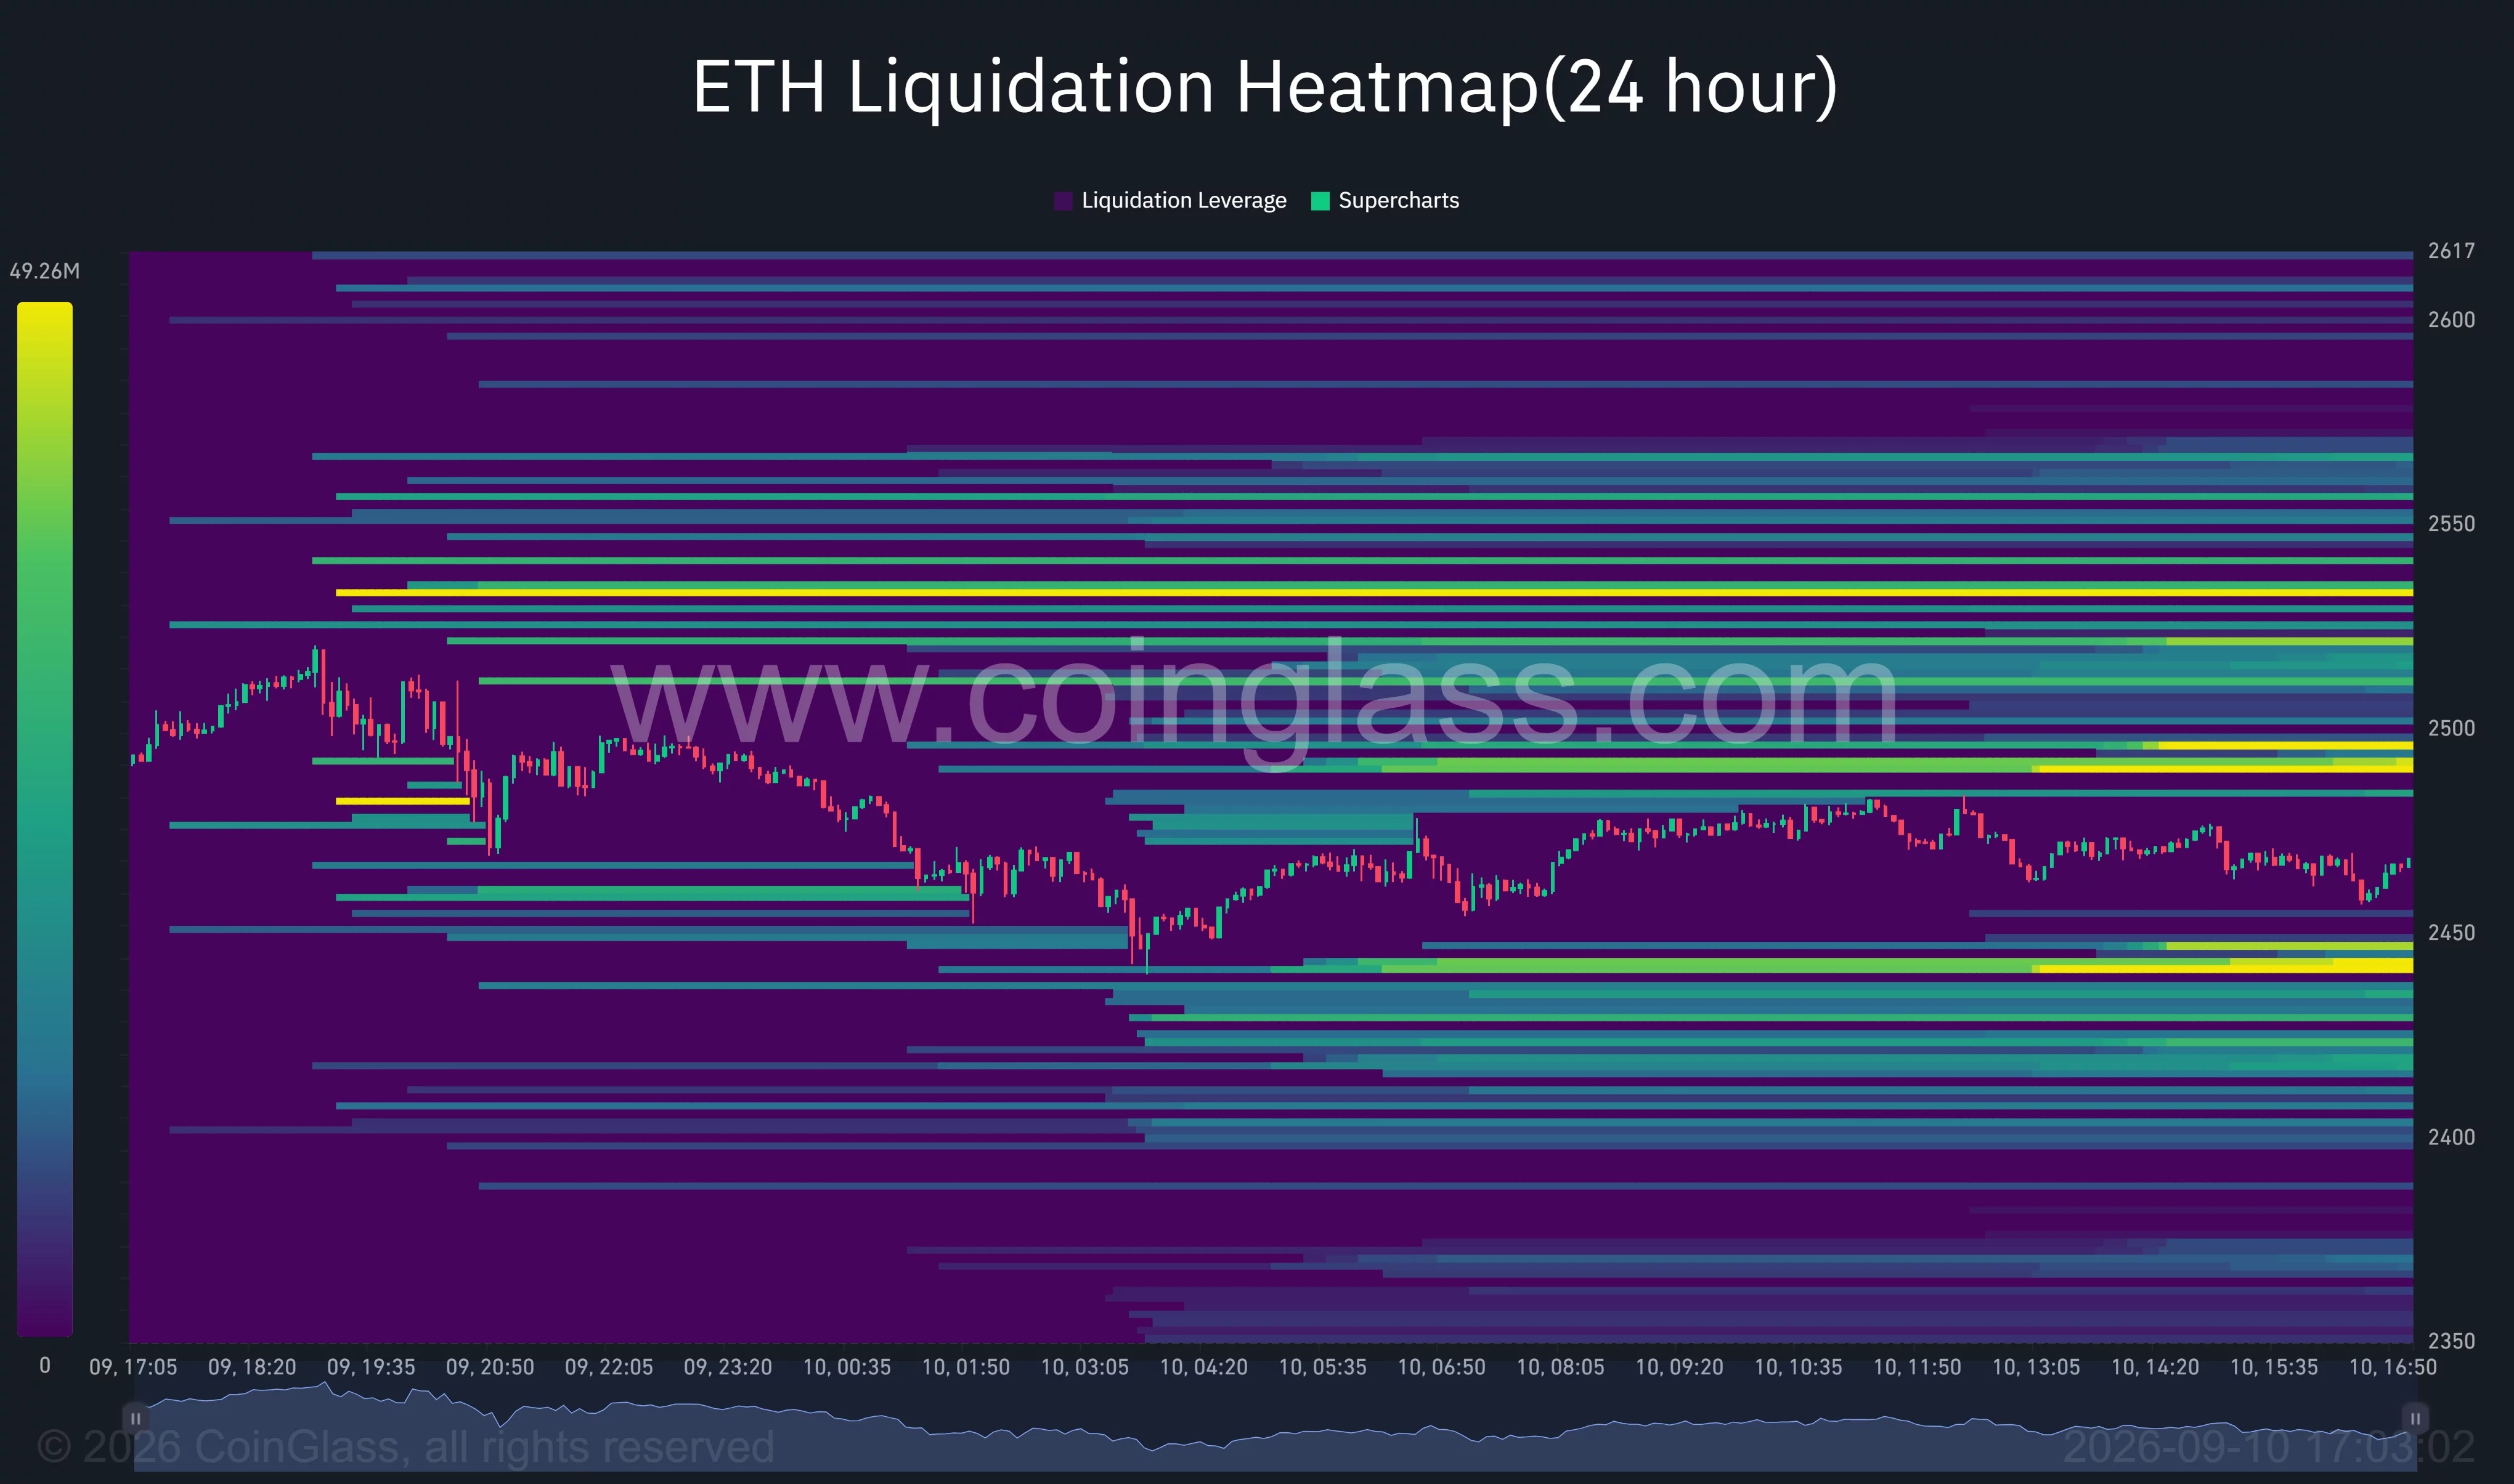
Clearing concentrated around $2,440 and $2,490
The 24-hour clearing heat map of CoinGlass shows that there are a considerable number of leveraged positions on both sides of the current price of ETH. The nearest major liquidity area below is around $2440, and further declines will reveal that there are still many positions distributed in the range of $2400 to $2430.
Above, there is a cluster of clearing zones around $2490, and there is also significant liquidity between $2520 and $2535. There is a concentration of positions near $2550 as well. This means that once the price breaks through either of these key levels, it could trigger a chain reaction of forced liquidations, amplifying the fluctuations within that range.
- Follow-up range below: $2440, $2400 to $2430
- Upper target range: $2490, $2520 to $2535
- Higher resistance level: around $2,550
The market is focusing on $2,550 and the Federal Reserve meeting.
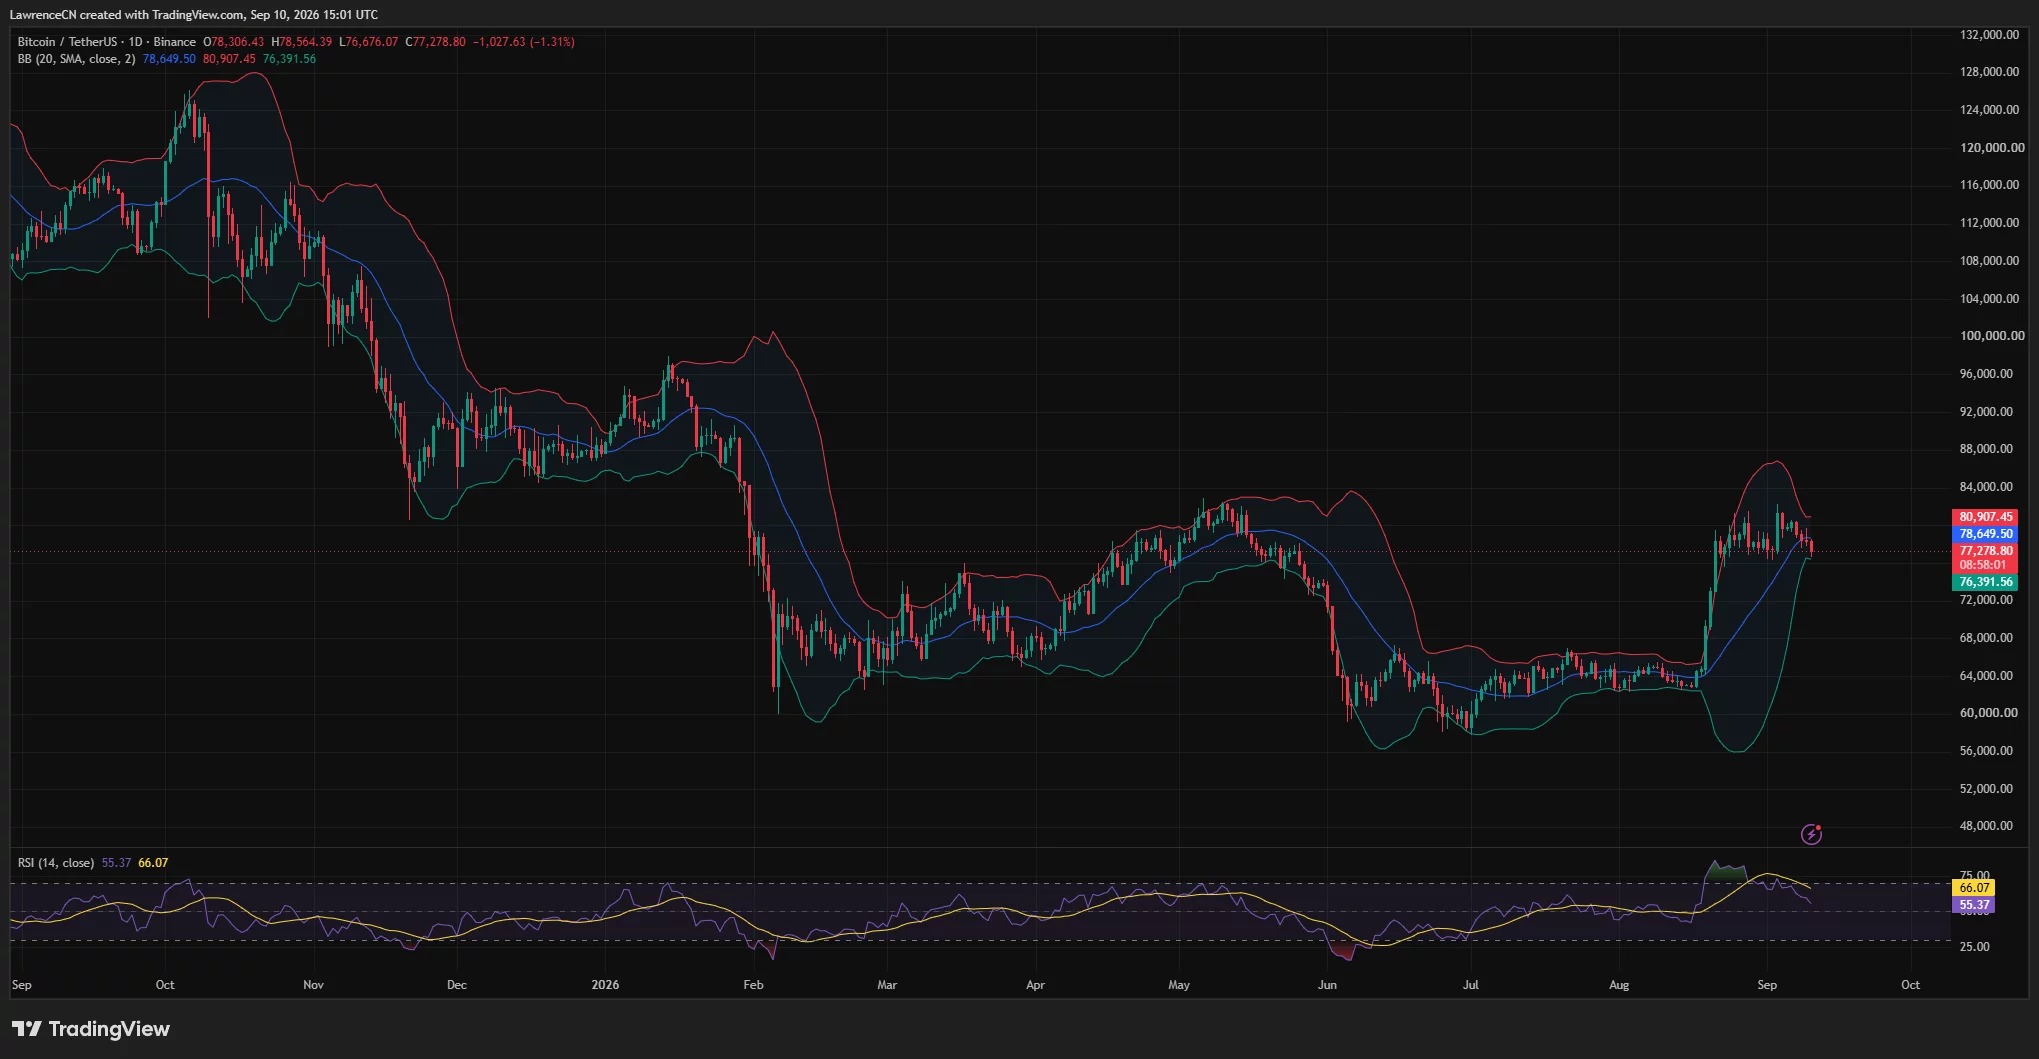
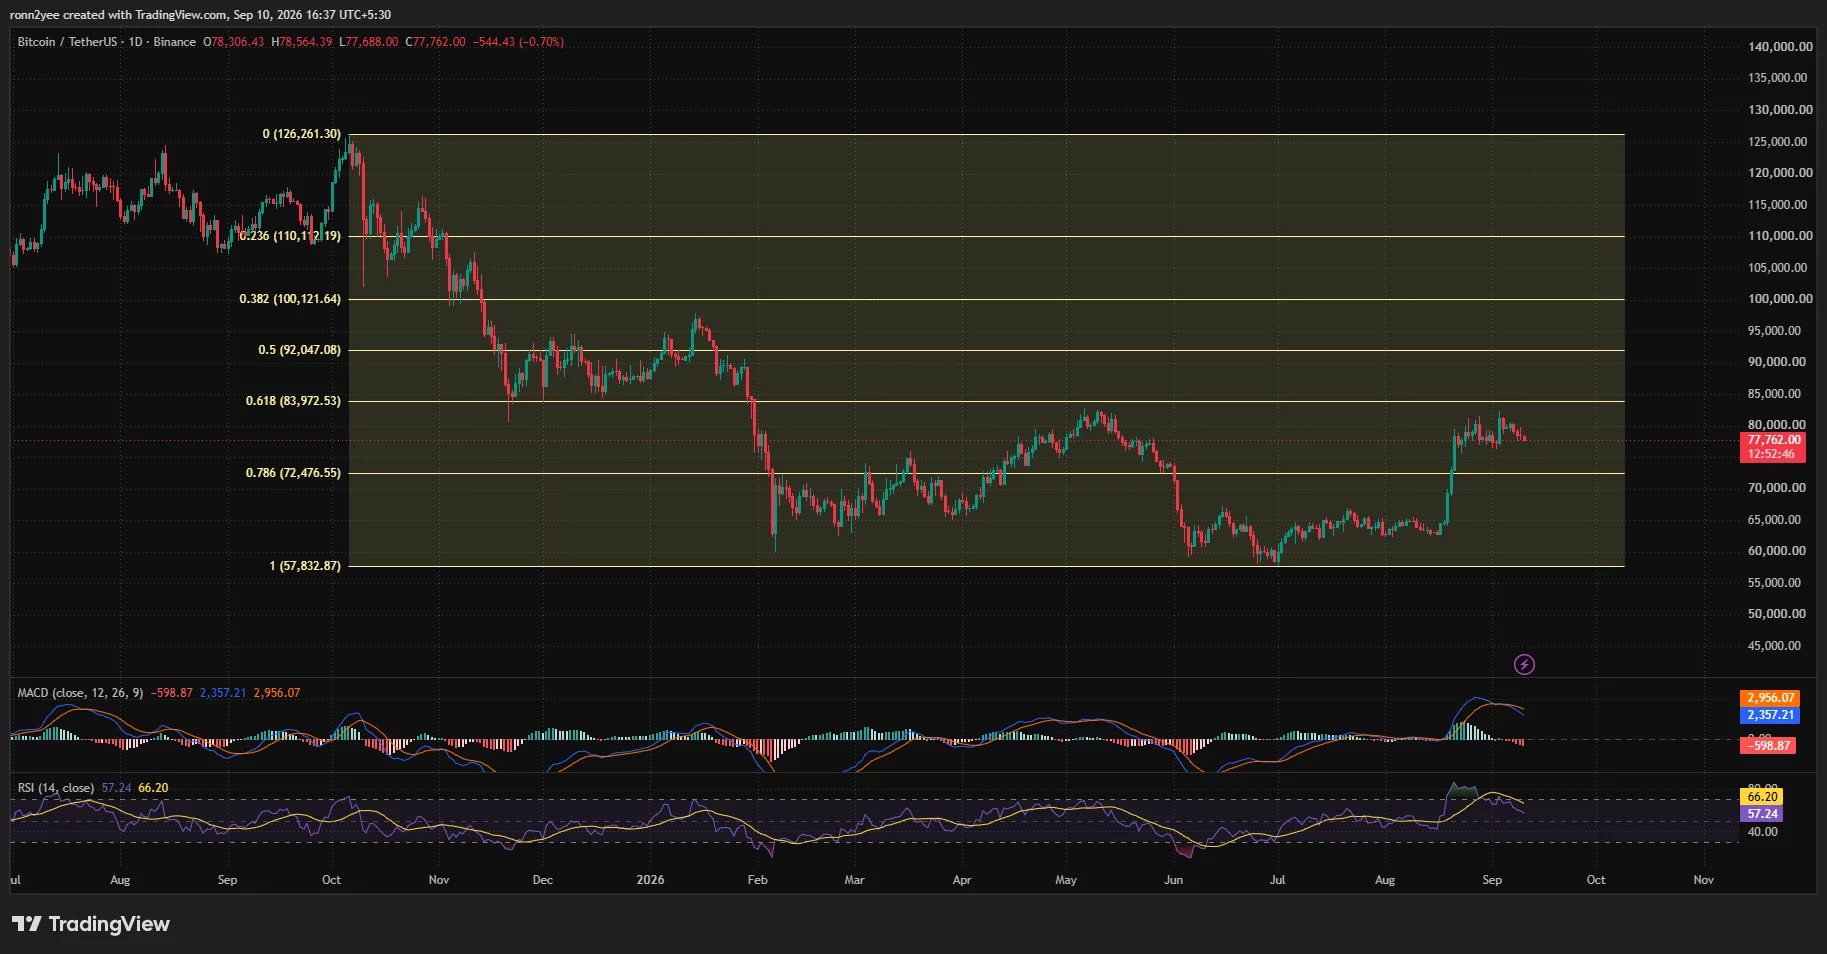
Market analysts generally regard the range of $2,450 to $2,550 as Ethereum's current main consolidation zone. Some traders believe that Ethereum's recent trading range is narrower than that of Bitcoin, indicating that neither the bulls nor the bears have established a clear advantage. Once the price moves outside this range, leveraged positions in the wrong direction could be quickly liquidated.
According to the analysis cited in the text, if the weekly close is above $2,550, ETH may move towards $2,656 next, followed by around $2,812. On the other hand, if the support at $2,450 is continuously lost, it could fall to around $2,344, and even further test the support around $2,215.
At the same time, the market is also awaiting the Federal Reserve's interest rate meeting on September 15th to 16th. Interest rate expectations, the trend of the US dollar, and changes in US Treasury yields may still become external catalysts for Ethereum to break out of its current consolidation range.