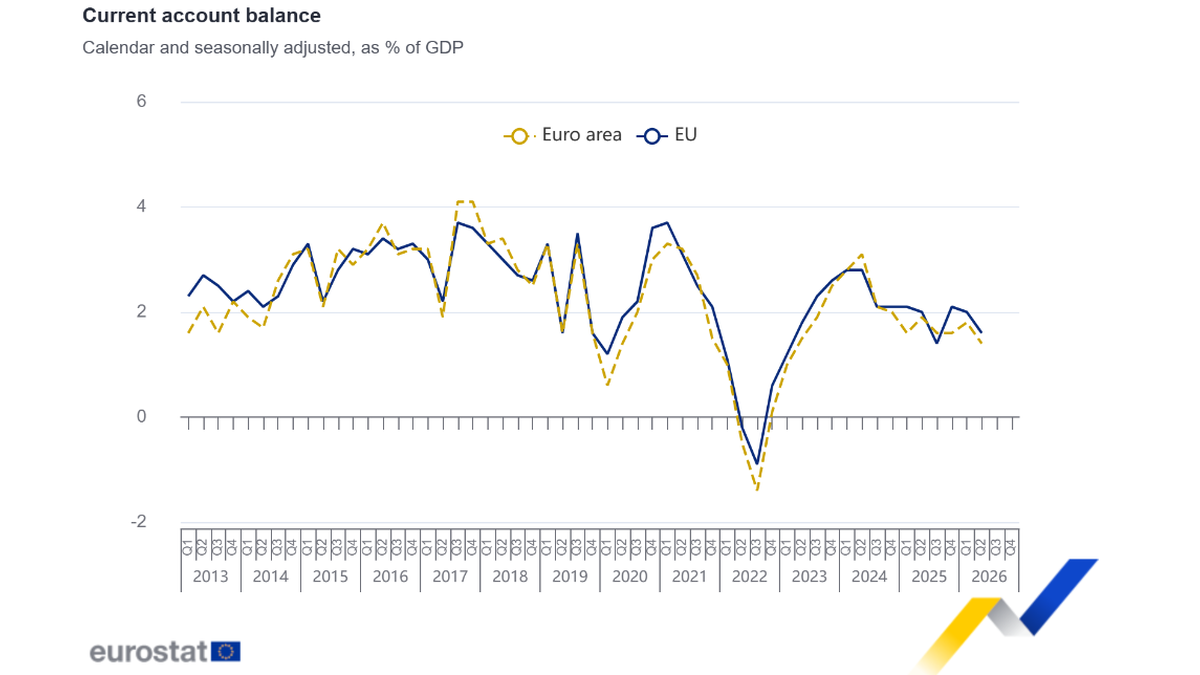
The balance of payments data released by the European Union Statistics Office on October 2nd showed a noteworthy change: in the second quarter of 2026, the EU's seasonally adjusted current account surplus was 80.2 billion euros, accounting for 1.6% of GDP; in the first quarter it was 98 billion euros, accounting for 2.0%, and in the same period last year it was 91.7 billion euros, also accounting for 2.0%. The surplus narrowed in both comparison periods, but one cannot simply conclude that "the EU's exports have suddenly lost competitiveness." The data indicates that the trade surplus in goods only decreased slightly from 63.6 billion euros to 62.9 billion euros; the more significant change came from the primary income account.
Current accounts record the transactions of goods, services, income, and regular transfers between a country and the rest of the world. If an economy sells more goods, it may accumulate a trade surplus; residents and businesses receiving dividends, interest, and wages from overseas also affect the balance of primary income. attributing all these changes solely to goods exports overlooks cross-border investments and can lead to a misinterpretation of the impact of financial markets on the real economy. The figure of 80.2 billion euros does not mean that "there is an extra amount of money in the EU's cash account"; rather, it represents a net amount for a quarter calculated according to the balance of payments framework.
The products are similar, but the service and initial revenue have pulled down the surplus.
Eurostat's detailed figures show that in the second quarter, there was a trade surplus of 62.9 billion euros in the goods account, compared to 63.6 billion euros in the first quarter; the surplus in the services account decreased from 48.1 billion euros to 41.7 billion euros. The more notable change occurred in the primary income account: there was a surplus of 15.7 billion euros in the first quarter, but only 800 million euros in the second quarter. The secondary income account continued to show a deficit, but it narrowed from around 29.3 billion euros to 25.2 billion euros, partially offsetting the declines in the previous two accounts. Taken together, the reduction in the overall surplus is not caused by any single type of trade.
Initial income includes remuneration for cross-border labor and investment returns, and is affected by various factors such as corporate profit distribution, interest, and dividend payments. It decreased from 15.7 billion to 8 billion between quarters, which is worth observing to see if this trend continues. However, it is not possible to conclude that there has been a systematic decline in returns on European assets based on just one quarter's data. Balance of payments statistics are often revised as new information becomes available, and quarterly fluctuations may be influenced by a few large transactions or settlement timing. News reports should acknowledge this uncertainty rather than attempting to provide a single, unverified official explanation for these changes.
A decrease in the service surplus does not necessarily mean a weakening of tourism. Service trade encompasses various types of transactions such as transportation, travel, finance, intellectual property, and business services. Without detailed data to support it, we cannot attribute the quarterly difference of 6.4 billion euros solely to a reduction in the number of tourists or a loss in competition in digital services. On the contrary, the breakdown of these figures is important because it indicates where we should look for changes next. What readers need is information about which figures are confirmed and which causal relationships are still unknown, rather than a macro story that sounds plausible but cannot be verified.
There is another easily overlooked pitfall in the statistical methodology: the figure of 80.2 billion euros mentioned refers to the total amount of the “European Union,” not the total amount of the “Eurozone.” The European Union includes member states that do not use the euro, while the balance of payments for the Eurozone is compiled by the European Central Bank; therefore, these two figures cannot be interchanged. In the report, the Eurozone’s current account surplus for the second quarter was 57 billion euros, which accounts for 1.4% of GDP. If the headline read “Eurozone surplus of 80.2 billion,” the main figure would already be incorrect.
One cannot consider the current account as a complete picture of the European economy.
There is also the financial account in the balance of payments. A current account surplus indicates that the net income from external current transactions is positive within a certain scope, but this does not mean that capital inflows are not needed, nor does it necessarily mean that domestic demand is weak. Funds may be allocated across borders in the form of direct investment, portfolio investment, or other means. For businesses, exchange rates, financing conditions, and supply chain arrangements are often more relevant than the figures of a single-quarter surplus. For policy observers, the current account can provide indications of changes in external balance, but it cannot replace data on inflation, employment, consumption, and production.
The European Statistical Office also provides unseasonally adjusted data for partners and member states. It is essential to maintain statistical boundaries here: one table is seasonally adjusted, while the other is not; one focuses solely on the EU's overall external transactions, while the other may include transactions between member states. It is not appropriate to simply add up the unseasonally adjusted country balances to explain the seasonally adjusted figure of 80.2 billion euros. The media often mixes these different datasets for the sake of presenting a neat country-by-country comparison, which gives readers the illusion of more specific information, but in reality, it undermines comparability.
A decrease in the surplus from 98 billion to 80.2 billion does not mean that the EU has shifted from a surplus to a deficit. It indicates that the net external income is still significantly positive, although it has narrowed compared to the first quarter and the same period last year. The percentage figure has also decreased from 2.0% to 1.6%, suggesting that the change is not solely due to the impact of economic size on the euro amount. Moving forward, it will be worth paying attention to whether service trade rebounds, whether primary income picks up, and whether the quarterly data will be revised later on. This is more valuable than guessing whether a single reading will immediately determine the exchange rate.
The clearest conclusion drawn from the second-quarter report is that the decline in the EU's external trade surplus does not correspond to the simplistic narrative of "goods not being sold." There is still a significant surplus in goods trade, while services trade has seen a decline, and changes in primary income are even more pronounced. The interpretation of macroeconomic data involves breaking down the overall figures and then placing each component back into its correct context and time frame. Only by doing so can the figure of 80.2 billion euros be understood as a clue to Europe's external economic relations, rather than merely a number that can be arbitrarily labeled as optimistic or pessimistic.
Source: Eurostat, “EU current account surplus €80.2 bn”, October 2, 2026, https :// ec.europa.eu / eurostat / web / products-euro-indicators /w/2-02102026- cp