

The key price moving averages are approaching a significant bullish pattern for confirmation, which is the first time such a pattern has appeared in over a year.
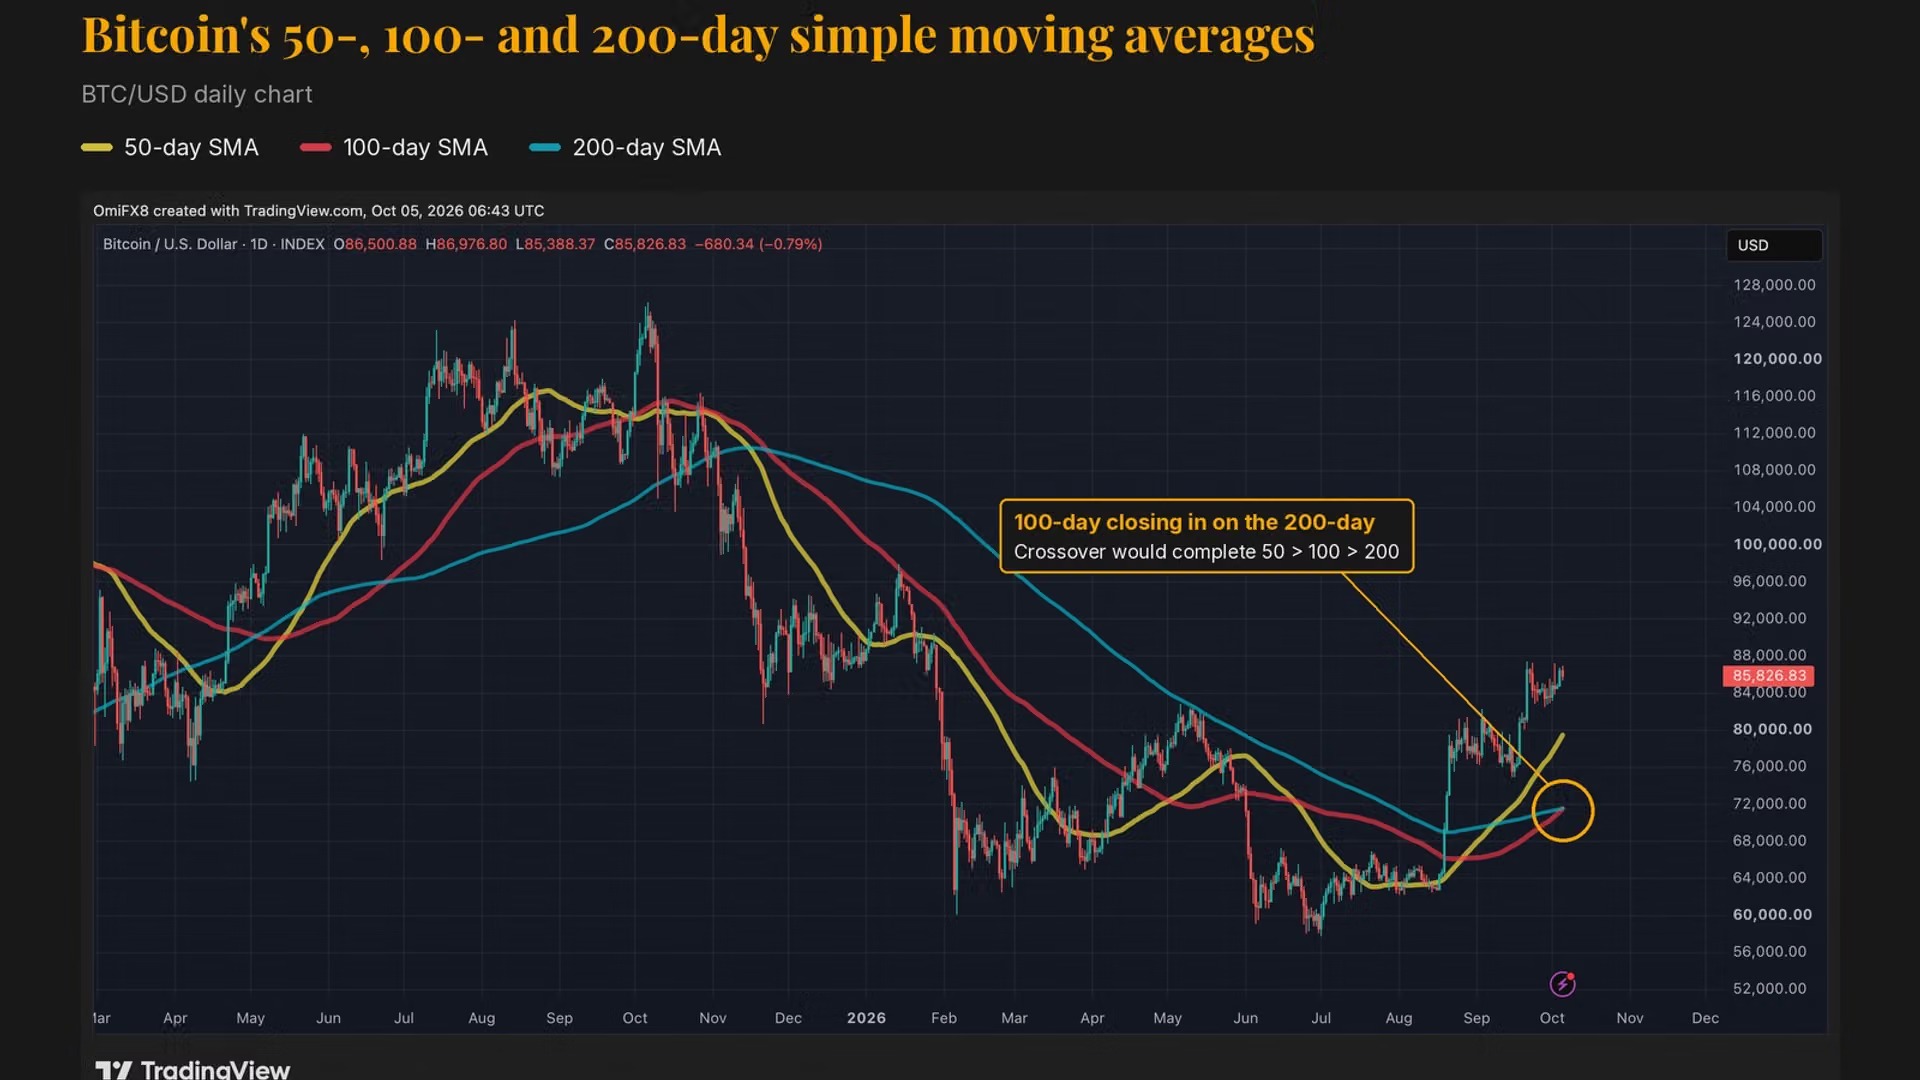
Bitcoin's 50-day, 100-day, and 200-day moving averages are approaching their first completely bullish alignment since 2025, which further strengthens the indication that its three-month rebound is still ongoing.
In the third quarter, Bitcoin rose by more than 40% to $87,000; however, with the strengthening of the US dollar, its upward trend has recently stagnated around $85,000.
Similar patterns have previously indicated significant increases, but they have also only resulted in brief gains. Therefore, whether Bitcoin can continue to remain above the 50-day moving average will become the next key test.
Bitcoin BTC is currently trading at $86,199.69. It fell today, but the broader trend presents a different picture.
In the past 50, 100, and 200 days, the simple moving averages of its price have formed a completely bullish arrangement, with only one "crossover" missing. By then, the short-term, medium-term, and long-term trends of this cryptocurrency will all be pointing upwards simultaneously. This would be the first time such a scenario has occurred since 2025.
This arrangement indicates that the 50-day moving average is above the 100-day moving average, and the 100-day moving average is above the 200-day moving average. This situation is now very close to occurring. As of the time of writing, the 50-day moving average is at $79,495, which is significantly higher than the other two moving averages. At the same time, the 100-day moving average, currently at $79,493, is rising and is approaching the 200-day moving average of $79,539. Once that happens, the three moving averages will be arranged in a order that shows bullish momentum for all three time frames.
The CEO of the Giottus exchange, which is regulated by FIU in India, told CoinDesk: "This crossover will restore the order where the 50-day moving average is above the 100-day moving average, and the 100-day moving average is above the 200-day moving average. This is the first time such a pattern has appeared since June 24, 2025."
Traders use moving averages to determine the direction of trends. When the short-term moving average is above the long-term moving average, it indicates that recent prices are stronger than earlier prices, which is generally considered a signal of upward momentum.
Therefore, this upcoming signal indicates that the price rebound of Bitcoin over the past three months is real. In the third quarter, the price of the token rose by more than 40%, to $87,000. Recently, against the backdrop of a continuous upward trend in the US dollar index, the upward momentum has slowed down around $85,000.
Some past patterns have marked the beginning of significant rises. A pattern formed on October 27, 2020, when the price of BTC was around $13,600, and this pattern persisted until May 2021. By then, Bitcoin had reached a record high of over $64,000. Another pattern confirmed in early November 2023 continued until May 2024, during which time Bitcoin rose from around $35,000 to $73,000, representing a more than doubling of its value.
However, the returns from other arrangements were not so impressive. A bullish arrangement formed in June 2025 lasted for 97 days, but Bitcoin only rose moderately, from around $106,000 to $112,000. A similar pattern that appeared in June 2024 only lasted for 20 days, during which Bitcoin fell by about 10%.
Subburaj indicates: 'This intersection will strengthen the trend judgment, but it does not guarantee the continuation of the trend. How asset prices perform thereafter will determine whether it will ultimately become a sustained bull market structure or just another brief arrangement.'
He explained that the real test now is whether the spot price of Bitcoin can continue to remain above the 50-day moving average.

"The more critical test is whether Bitcoin can hold above the 50-day moving average during the pullback period," he said.