

Ethereum prices have fallen below $2,600, and with the escalation of tensions around the Strait of Hormuz, there has been a broader sell-off of cryptocurrencies. ETH is approaching a key technical support level.
Ethereum prices fell below $2,600 after geopolitical tensions triggered a broader sell-off in the crypto market.
After breaking below the 20-day moving average, ETH is currently testing the key support range of $2,500 to $2,560.
The daily chart RSI has dropped to 44.55, while the 4-hour chart shows that the trading price of ETH is below the lower band of the Bollinger Bands.
Analysts say that if the range of $2,500 to $2,560 can be maintained, ETH still has a chance to rebound to $3,000; if it is lost, the pullback could deepen further.
As of October 7th at the time of publication, the price of Ethereum ( ETH ) was around $2,565, which represents a decrease of about 5% from its intraday high of nearly $2,700. After attempting to break through around $2,800 earlier on, the weak trend of ETH continued.
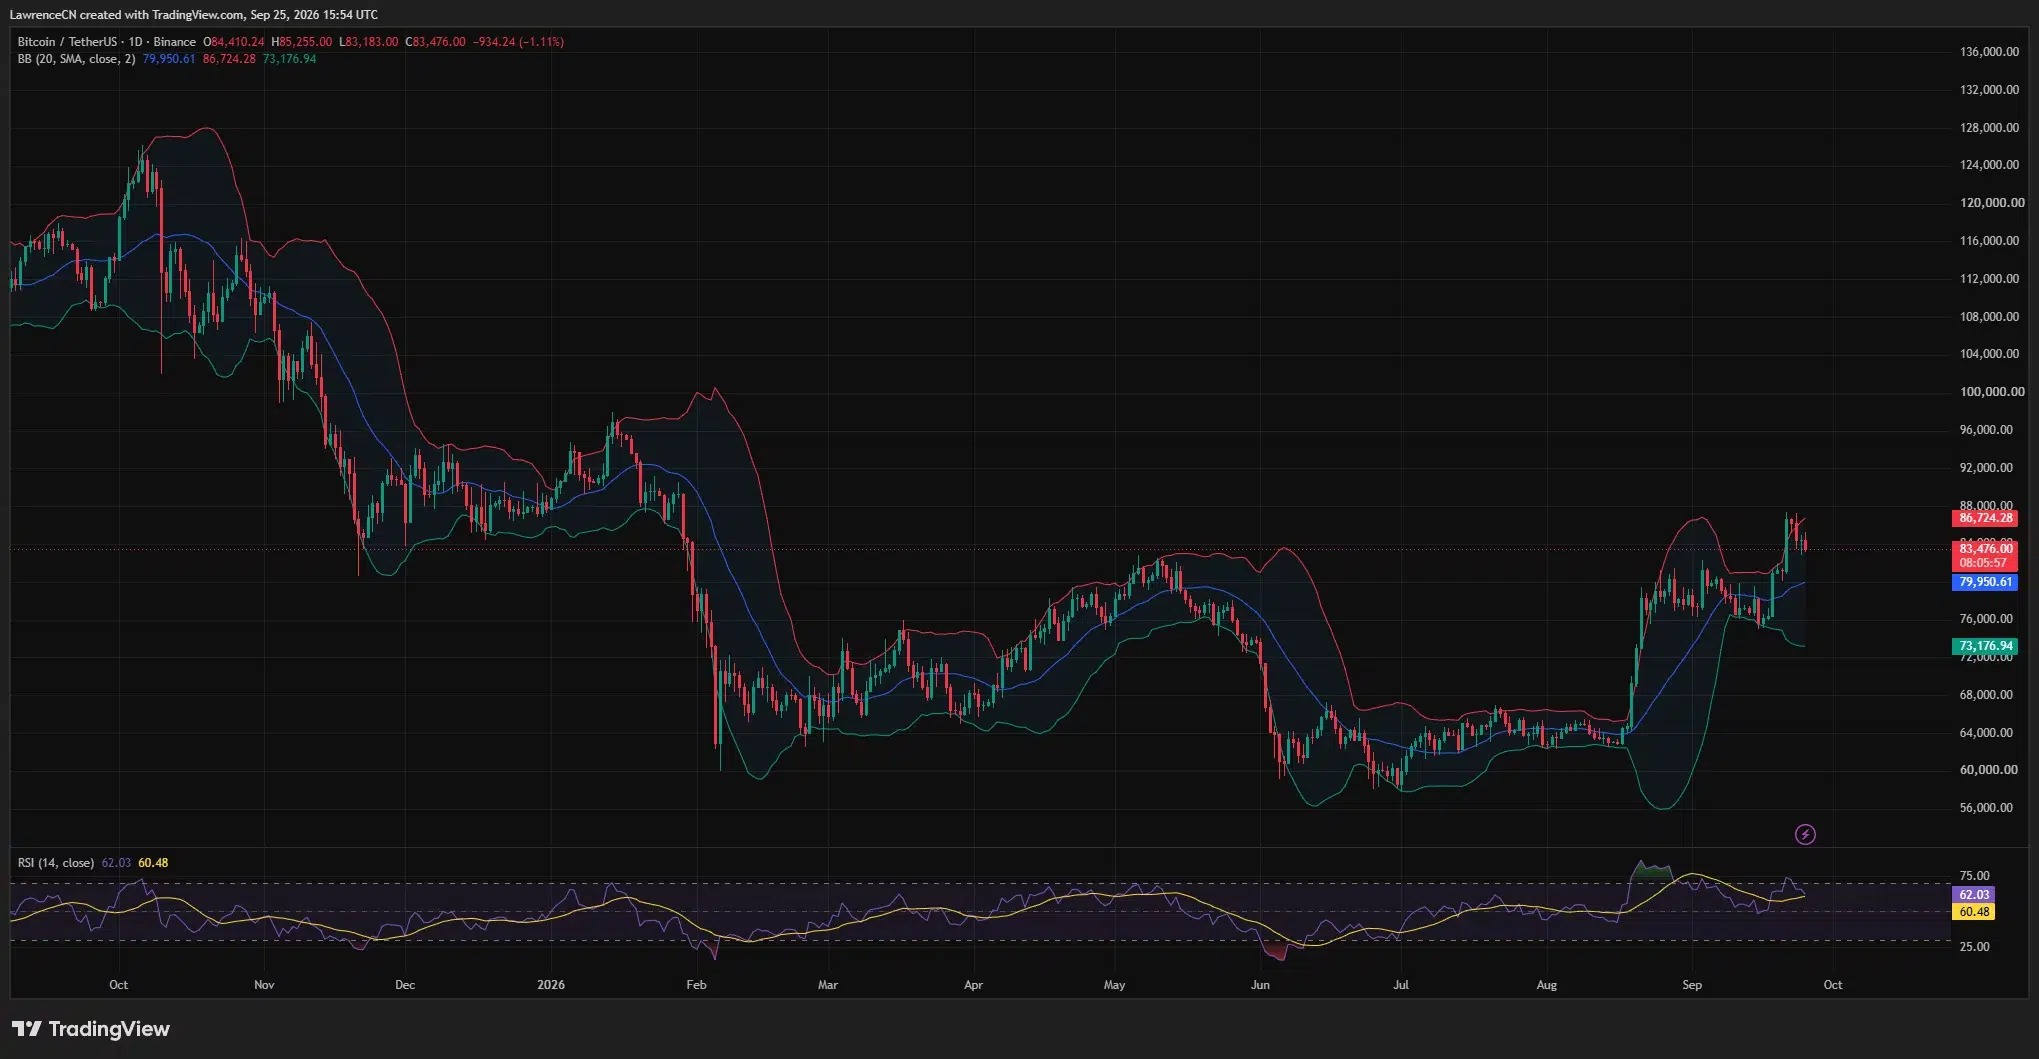
This round of selling coincided with a sharp reversal in the broader crypto market. Bitcoin fell from around $86,600 on October 7 to a low of nearly $83,060, a decrease of about $2,000 in just 30 minutes.
Earlier reports indicated that attacks involving oil tankers near the Strait of Hormuz had escalated, sparking concerns among markets about potential disruptions to this crucial global energy route. This sentiment of risk aversion also drove up the price of Brent crude oil to around $101.50 per barrel, while the yield on 10-year U.S. Treasury bonds rose to approximately 5.31%.
Rising oil prices have reignited concerns about inflation, while increasing yields on government bonds will boost the returns on government debt, thereby reducing demand for risky assets.
Leverage also accelerated the decline of cryptocurrencies. According to market data, during the sharp market drop on October 7th, more than $400 million in leveraged long positions were liquidated, which further triggered selling as prices continued to fall.
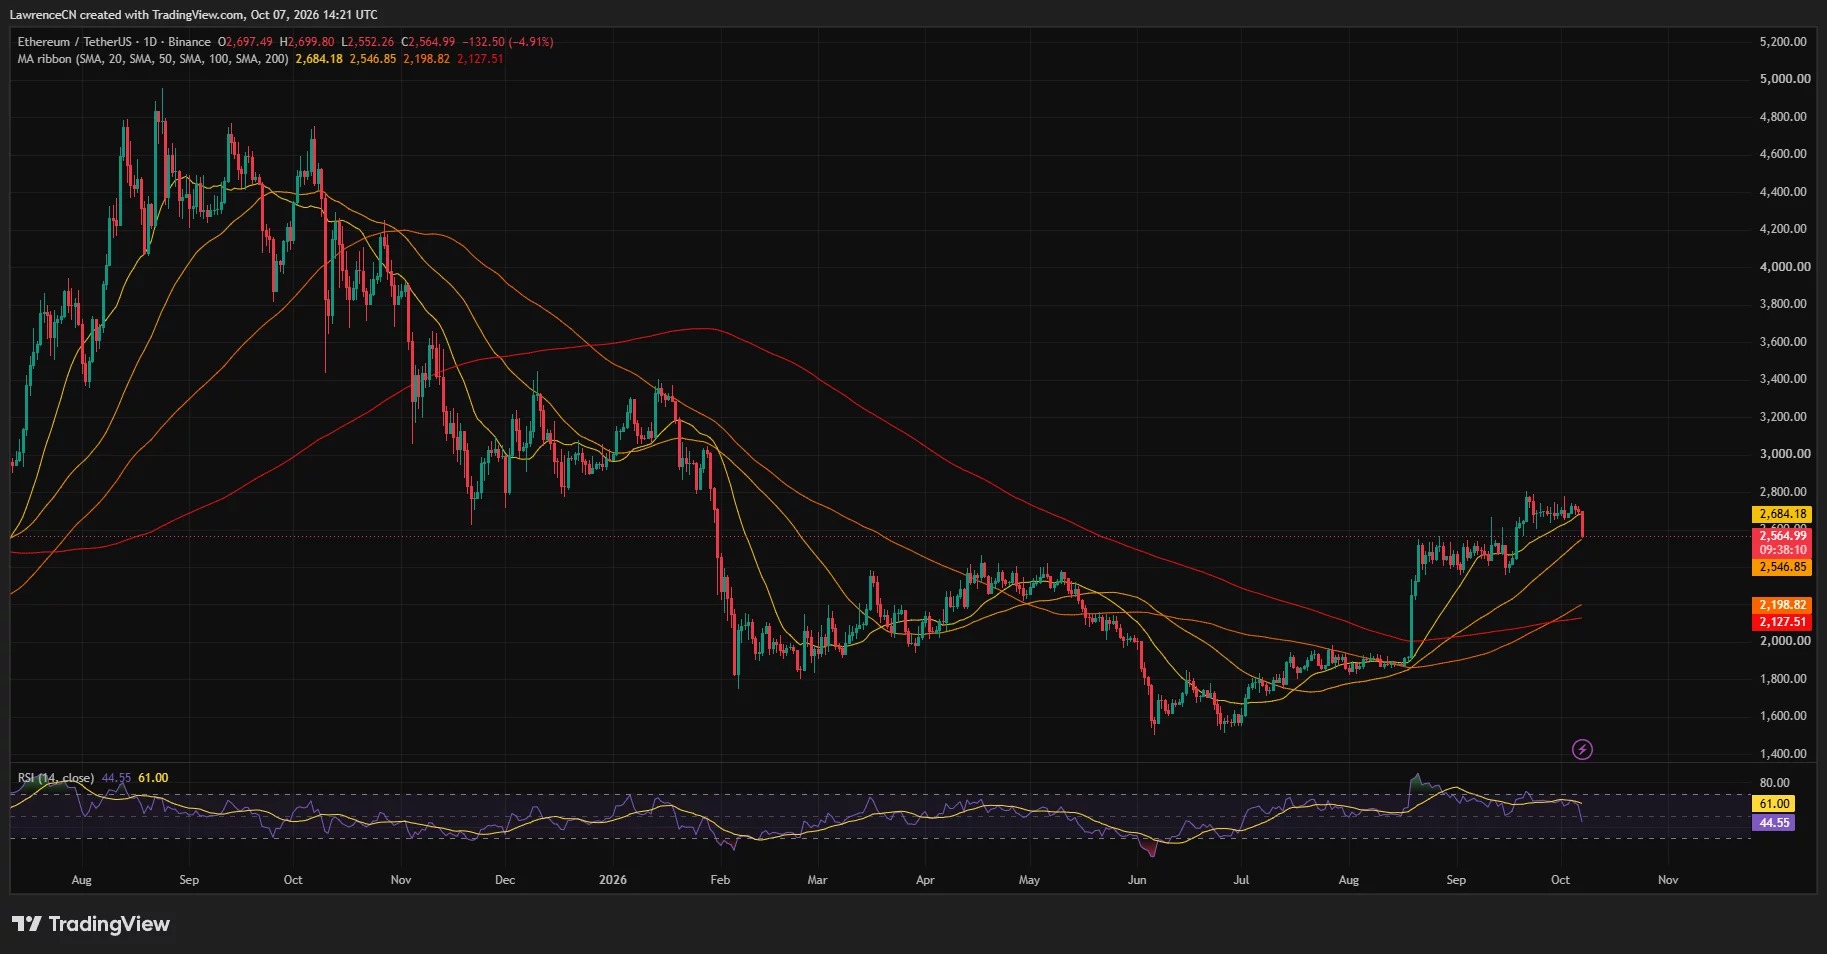
The one-week settlement heat map of CoinGlass shows how this round of decline has propelled ETH to pass through several leveraged concentration zones. The price has dropped from around $2,700 to the mid-$2,500 range, while liquidity remains concentrated around $2,640 to $2,660; however, a larger concentration zone is located above $2,700.
Ethereum price testing key support level
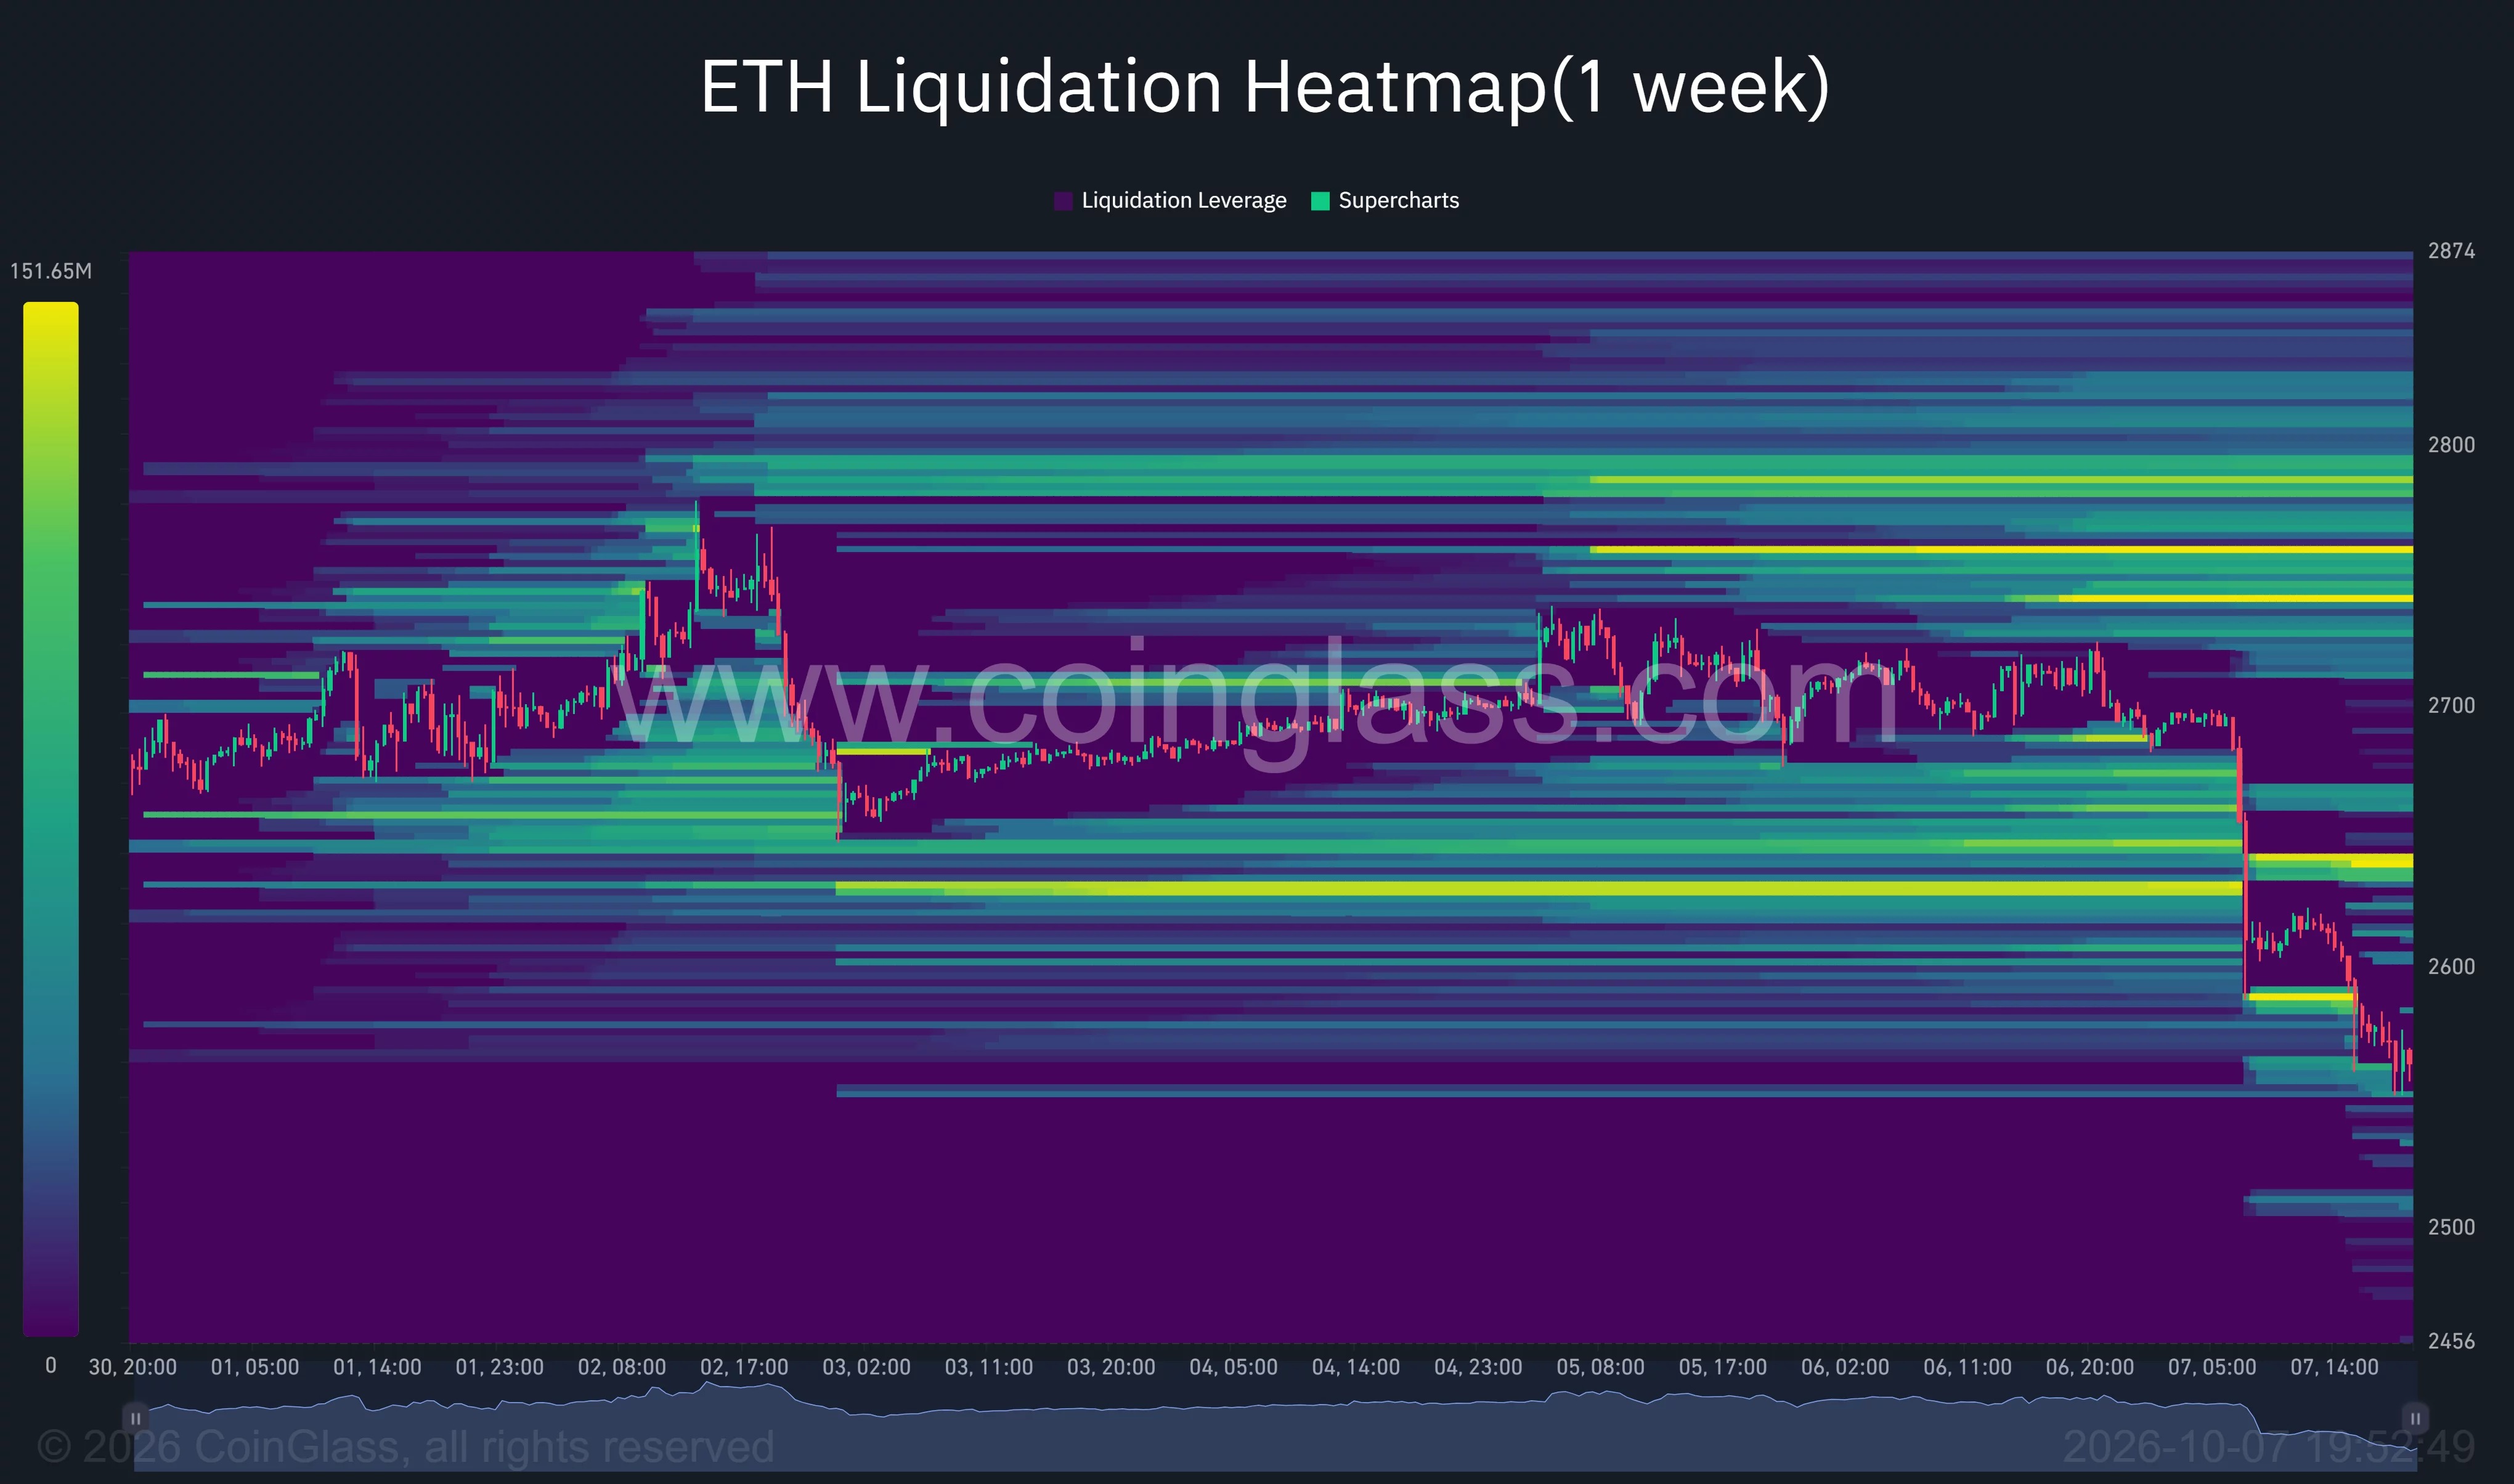
The Ethereum daily chart shows that after ETH failed to extend the September rebound above $2,800, it fell below the 20-day simple moving average of $2,684.
However, ETH is still above the longer-term moving averages. The 50-day simple moving average is around $2,565, which almost coincides with the current price; the 100-day and 200-day moving averages are near $2,199 and $2,128 respectively.
Therefore, the 50-day moving average has become the first major technical test after the sell-off. If the price can hold within the range of $2,550 to $2,565, ETH may stabilize after the sharp decline; if the daily price clearly falls below this range, then the structure formed during the rebound periods in August and September will weaken.
Kinetic energy has also deteriorated. The daily relative strength index has dropped to 44.55, below the neutral level of 50, and far lower than the previous reading of around 61. This indicator has not yet entered an oversold zone, which means that if selling continues, there is still room for further decline.
The 4-hour chart shows a similarly weak short-term pattern. ETH has fallen below the lower Bollinger Band at around $2,589, while the upper band is significantly higher at around $2,684.
The upper track is approaching $2,780, which makes the range of $2,680 to $2,700 an important level for any rebound attempts. ADX has risen to 24.36, close to the 25 level that is generally considered to indicate a strengthening trend.
Analysts are focusing on $2,500 to $2,560 as the next test for ETH.
Cryptocurrency trader Merlijn The Trader views the current decline as a backtest of Ethereum's previous triangular breakout, stating that the range between $2500 and $2560 is a critical area that needs to be held.
"Hold at $2,500 to $2,560; the next target is $3,000."
His chart places the current pullback near the previous breakout area, indicating that if the buying pressure holds this range, the existing bullish structure could continue. In this case, regaining recent highs could potentially reopen the path to $3,000. However, ETH will first need to overcome the resistance around $2,680 to $2,800.
Analyst Ted Pillows also mentioned the longer-term moving average structure of Ethereum after it reached $2,600 on ETH. He stated that the token is approaching the 100-week exponential moving average, so the subsequent weekly closes are very important for the larger trend.
"If the weekly chart closes below the 100-week EMA, it could lead to a deeper correction."
Therefore, the weekly chart structure further reinforces the importance of the $2500 to $2600 range. If this range continues to be lost, ETH may face a more significant pullback; if it can be held, then the structure formed during the breakthrough in September will remain intact.
Disclosure:This article does not constitute investment advice. The content and materials on this page are for educational purposes only.