Brief
- Bitcoin once fell to $82,776.30 today and is currently at $83,178.54, a decrease of 2.76% for the day; meanwhile, oil prices have risen above $101, and bond yields are also on the rise.
- The daily chart still shows a strong trend, but technical indicators indicate that BTC is approaching an oversold area.
- Traders give a 67% probability that Bitcoin will reach $80,000 in October; they believe there is a 55% chance it will reach $87,500.
Bitcoin had a poor performance this morning. It opened at $85,543.66 and then tumbled to $82,776.30 before currently trading at $83,178.54. This decline seems to have scared off traders, as it fell rapidly within a few hours, threatening key support levels.
This 3.2% decline resulted in heavy losses for traders using leverage. According to CoinGlass data, approximately $969 million in crypto positions were liquidated within the past 24 hours, of which $644.47 million were long positions.
So what happened, and what will come next? Let's start with the “chief culprit,” because this is not just an encryption story.
Stock market declines, oil prices rise, bond yields soar
Wall Street is falling from its historical highs, with the S&P 500 index dropping 0.59% to 7,772.60 points during trading, and the Nasdaq index falling 0.71%.
The reason lies in oil prices. Brent crude oil has once again reached $101 per barrel, the yield on 10-year U.S. Treasury bonds is close to 5.34%, and the yield on 30-year U.S. Treasury bonds has touched 5.70%, the highest since 2002. Even traditional safe-haven asset gold has fallen by 1.53% to $4,123.10.
The reason for the fluctuations in oil prices is the increasing number of attacks on vessels in and around the Strait of Hormuz. Since October 2nd, the UK Maritime Trade Operations Office has recorded at least one incident per day in that strait or the Gulf of Aden, according to reports cited by Al-Arabiya television station.
On Monday, the Iranian Revolutionary Guards ordered an oil tanker that entered the strait to turn around, otherwise it would face the risk of attack. More expensive oil will exacerbate inflation concerns, drive up yields, and put pressure on risky assets such as Bitcoin.
Oil prices have also previously impacted Bitcoin. In June, amid tensions in the Middle East, Brent crude oil rose to $96, and Bitcoin fell to $65,590 at one point. In comparison, Bitcoin is currently still about 40% higher than its trading price of around $59,500 at the end of June.
The Federal Reserve also added to market tensions today, as its schedule indicates that the minutes from the meetings held on September 15th and 16th will be released today.
Bitcoin Price: Bullish on the daily chart, bearish on the four-hour chart
The four-hour chart shows that Bitcoin was rejected around $86,978.45, after which it began to fall. This decline pushed the price below $83,000, but then there was a rebound, so traders can breathe a sigh of relief to some extent.
Fibonacci retracement lines are used to mark potential pause points in prices, drawn based on a percentage of the previous trend. According to this round of decline, the current levels most worth watching during trading are $83,768.01 and $84,877.38; both of these levels now act as resistance.
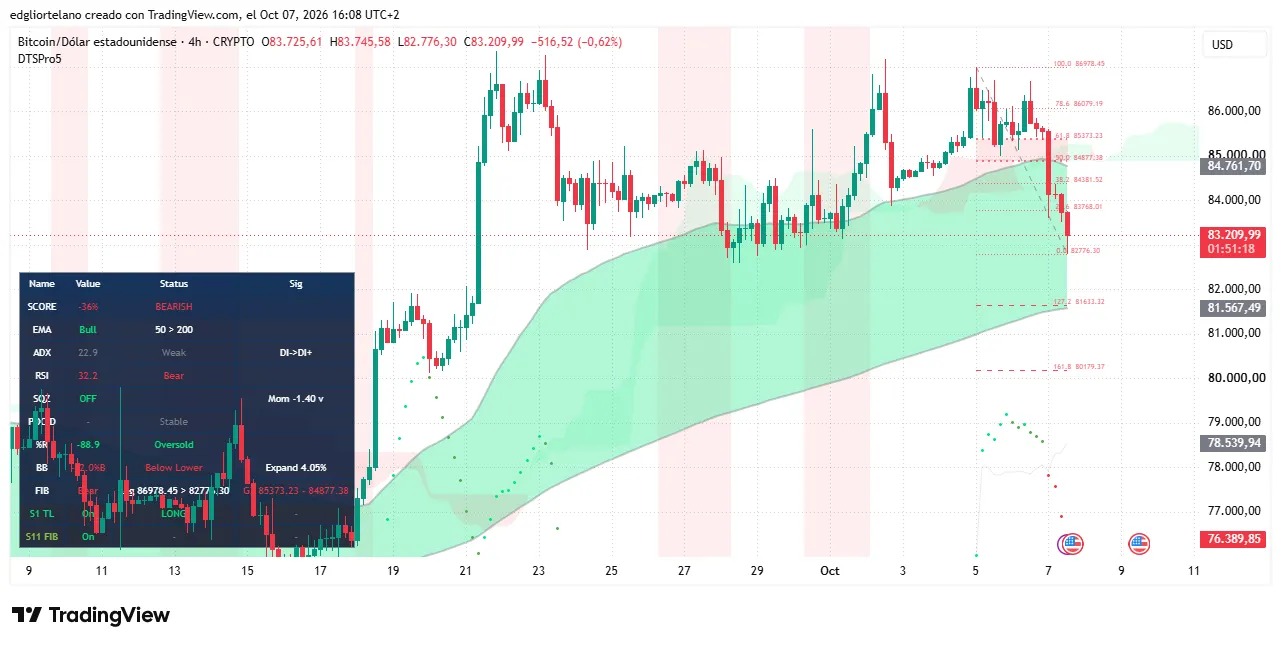
Relative Strength Index, namely RSI, measures momentum between 0 and 100 within this short four-hour time frame. The current reading is 32.2, indicating that Bitcoin is significantly oversold, reflecting the panic caused by this rapid selling off. During intraday trading, this usually signifies bearish momentum, but it also tends to attract buyers looking for opportunities to pick up stocks at lower prices, with hopes of a rebound over a longer period.
When zoomed out to the daily chart, the Average Directional Index, which is ADX, reads 42.8, indicating a strong upward trend, with buyers still in the ascendancy. The RSI value in the daily candlestick chart is 52.5, which falls within a neutral range; therefore, this round of selling has hardly caused any substantial damage to the momentum over a longer time period.
The Exponential Moving Average, namely EMA, tracks the average price over a certain period and assigns greater weight to recent prices. Whether on the daily chart or the four-hour chart, the 50-day EMA is still higher than the 200-day EMA, which usually indicates that a broader upward trend has not yet been broken. The "squeeze" pattern on the daily chart continues, with a momentum reading of 1.17 that is currently declining, suggesting that volatility remains suppressed.
The intraday low of $82,776.30 was only about $150 higher than the Fibonacci retracement level corresponding to approximately $82,626.41.
As oil prices and yields rise, stocks, gold, and Bitcoin all fall simultaneously, indicating that this is not a problem inherent to the crypto market itself.
Therefore, macroeconomic factors acted as the fuse, but leverage amplified the fire. When prices fall, exchanges are forced to close leveraged positions that cannot cover the losses, and these forced sales in turn push prices even lower.
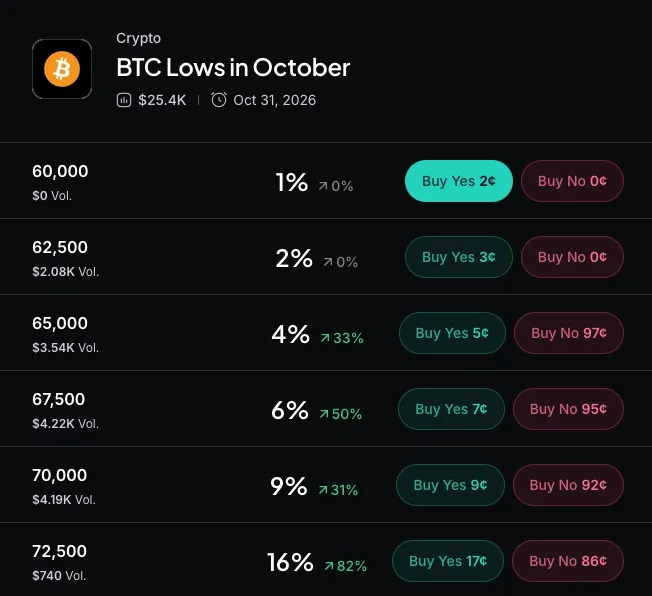
Traders on the prediction market Myriad developed by parent company Dastan are already pricing in more downside potential. As of press time, the BTC lows in October market is giving a 92% probability that Bitcoin will touch $82,500 this month, a 67% probability of reaching $80,000, and a 43% probability of hitting $77,500.
Upward bets are more cautious. BTC highs in October The market estimates a 55% probability that Bitcoin will reach $87,500 and a 36% probability that it will reach $90,000. The settlement basis for these markets is based on "reaching" the target price as indicated by Binance rather than the closing price; therefore, within the same month, it is possible for a decline to trigger the "yes" outcome as well as a rebound to trigger the "yes" outcome.
The bulls need to first regain $84,761.70, which is the top of the four-hour trend band, and then stay above the $84,877.38 retracement level, in order to indicate that this round of decline has ended. If $82,776.30 is lost, the next support levels will be the bottom of the four-hour trend band at $81,567.49, as well as the 50% retracement level on the daily chart at $81,165.95. Minutes from the Federal Reserve meetings and any new developments regarding the Strait of Hormuz will be catalysts that need to be watched for in the coming period.
Disclaimer
The views expressed by the author are for informational purposes only and do not constitute financial, investment, or other advice.