

Hyperliquid Pressure rises
Hyperliquid is experiencing another round of rapid correction, as its previous rebound failed to continue near the high points of September. HYPE is currently trading at around $88.60, down from the intraday high of $92, putting further pressure on the short-term bullish outlook.
The trend over a longer period is still upward. HYPE has been rising from around $57 in mid-August, reaching a high of nearly $97.50 in September, and the price remains firmly above the medium to long-term moving average. However, the latest structure indicates that momentum is weakening.
After reaching $97.50, HYPE first pulled back to around $85, then rebounded to around $95. It failed to set a new high, and subsequently a strong bearish candlestick appeared, forming a potential "lower high" structure. Meanwhile, RSI has slipped into a neutral area, indicating that buyer momentum has weakened.
The current support level is around $87-$88, close to the rising short-term moving average. An even more important support level is at $84-$85, where there has been significant buying activity before.
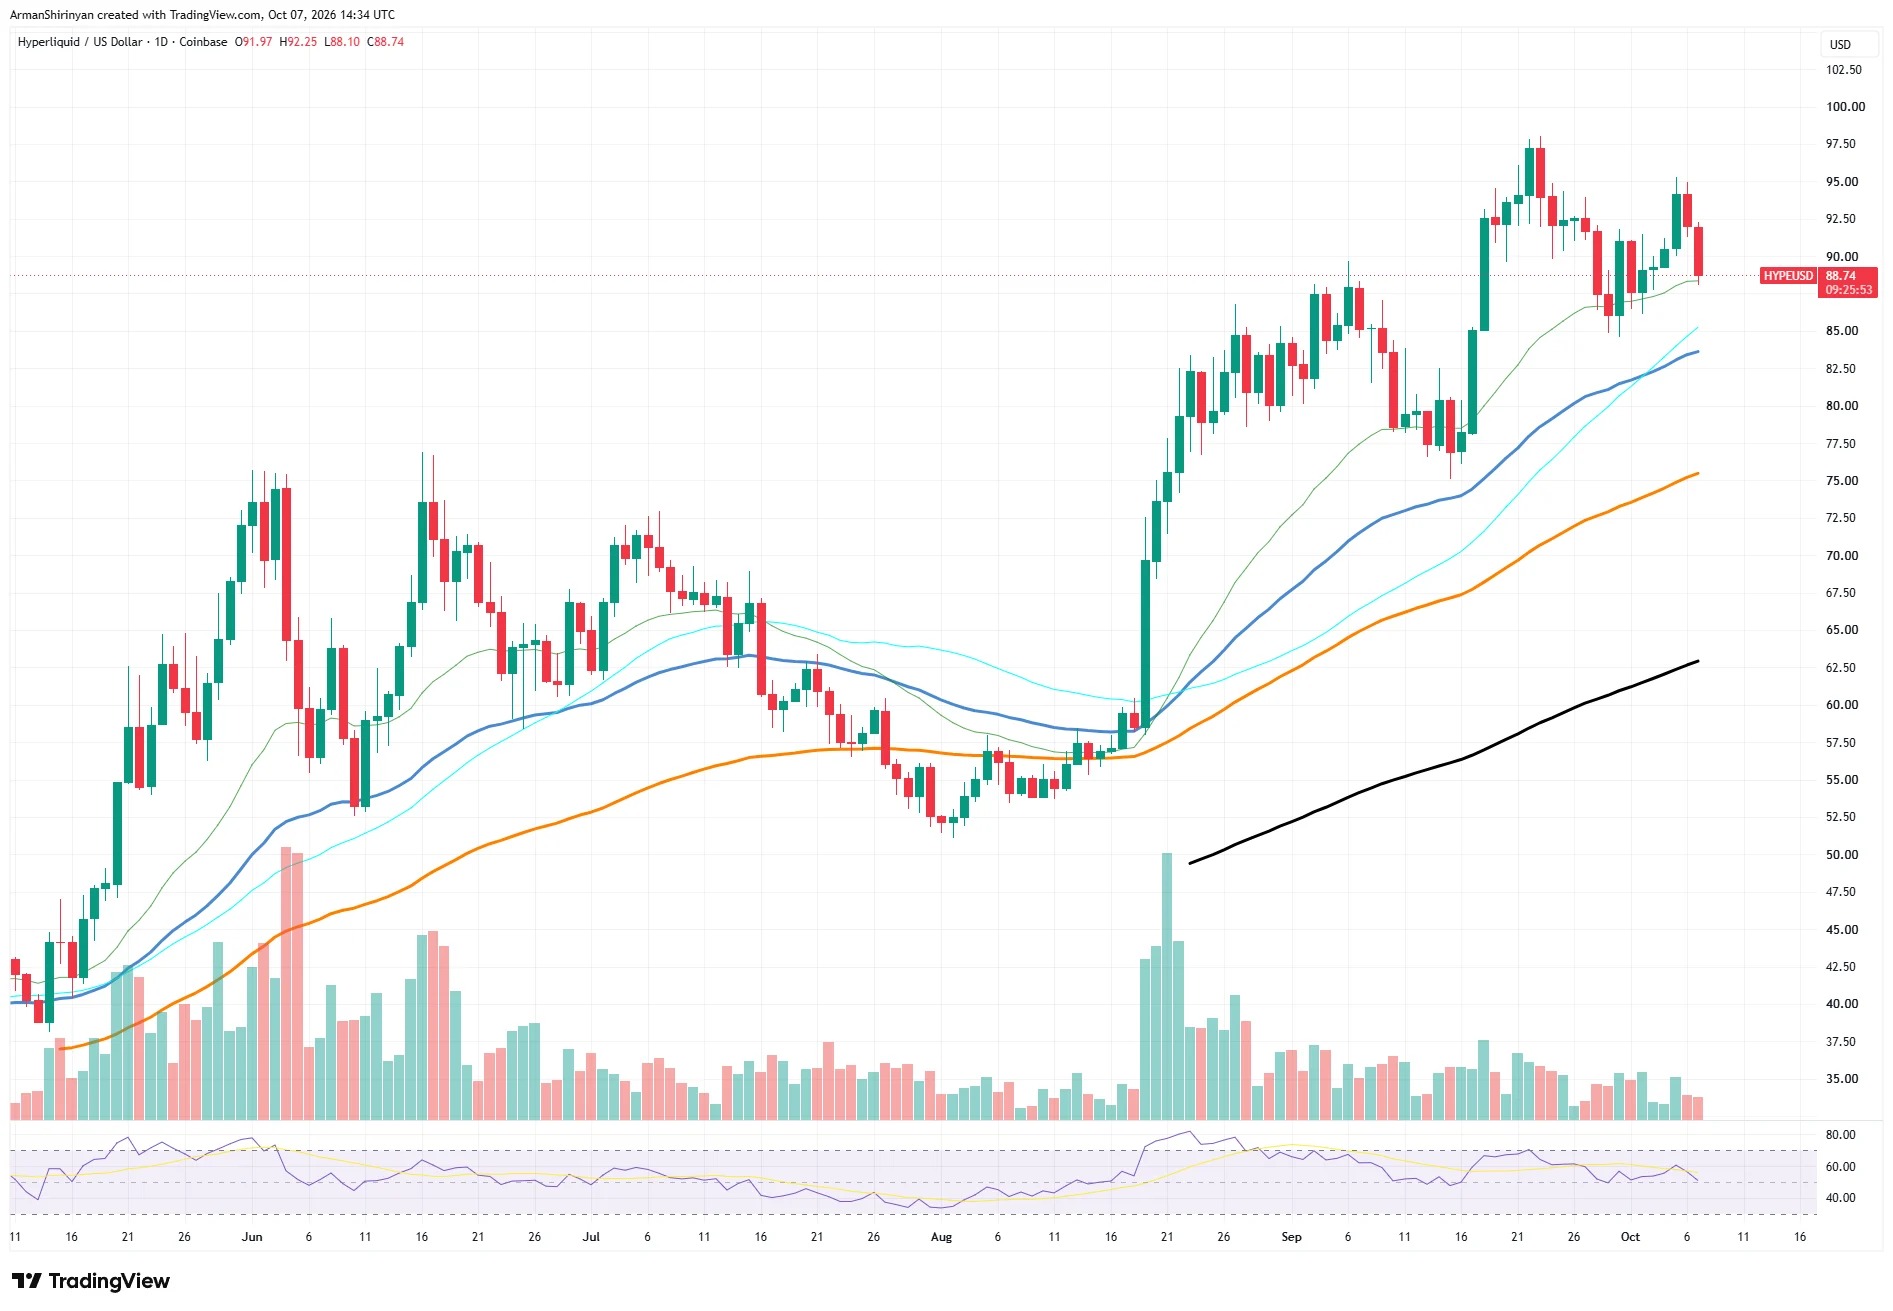
If it falls below $84, it could trigger a deeper correction, with the target range being $80–$82. Further down, around $75, would become the next important technical level.
For the bulls, regaining above $92.50 would improve the technical pattern; however, to initiate a larger upward trend and potentially open the way to the psychological barrier of $100, a valid breakout above the $95–$97.50 range is necessary.
Currently, looking at a larger time frame, the structure of HYPE is still relatively complex, but it has encountered resistance again around $95, which has increased the short-term downside risk.
XRP Remains Under Pressure After an Unexpected Rebound
XRP In September, the rebound reached a high of around $1.65, but buyers subsequently failed to push for further breakthroughs on several occasions. Subsequently, the price formed several lower highs around $1.55, $1.53, and $1.52, indicating that demand was gradually weakening.
Current market attention has shifted to the $1.40 level. The medium-term moving average is around this level, while longer-term support is concentrated in the $1.37–$1.38 range. Therefore, the $1.37–$1.40 range is particularly crucial for the larger trend.
If it clearly falls below $1.37, it may drop to between $1.30 and $1.33, erasing a significant portion of the rebound seen in September as indicated by XRP. Momentum is also weakening, with RSI having fallen back to around 50, whereas during the previous upward phase, RSI remained relatively strong for the most part.
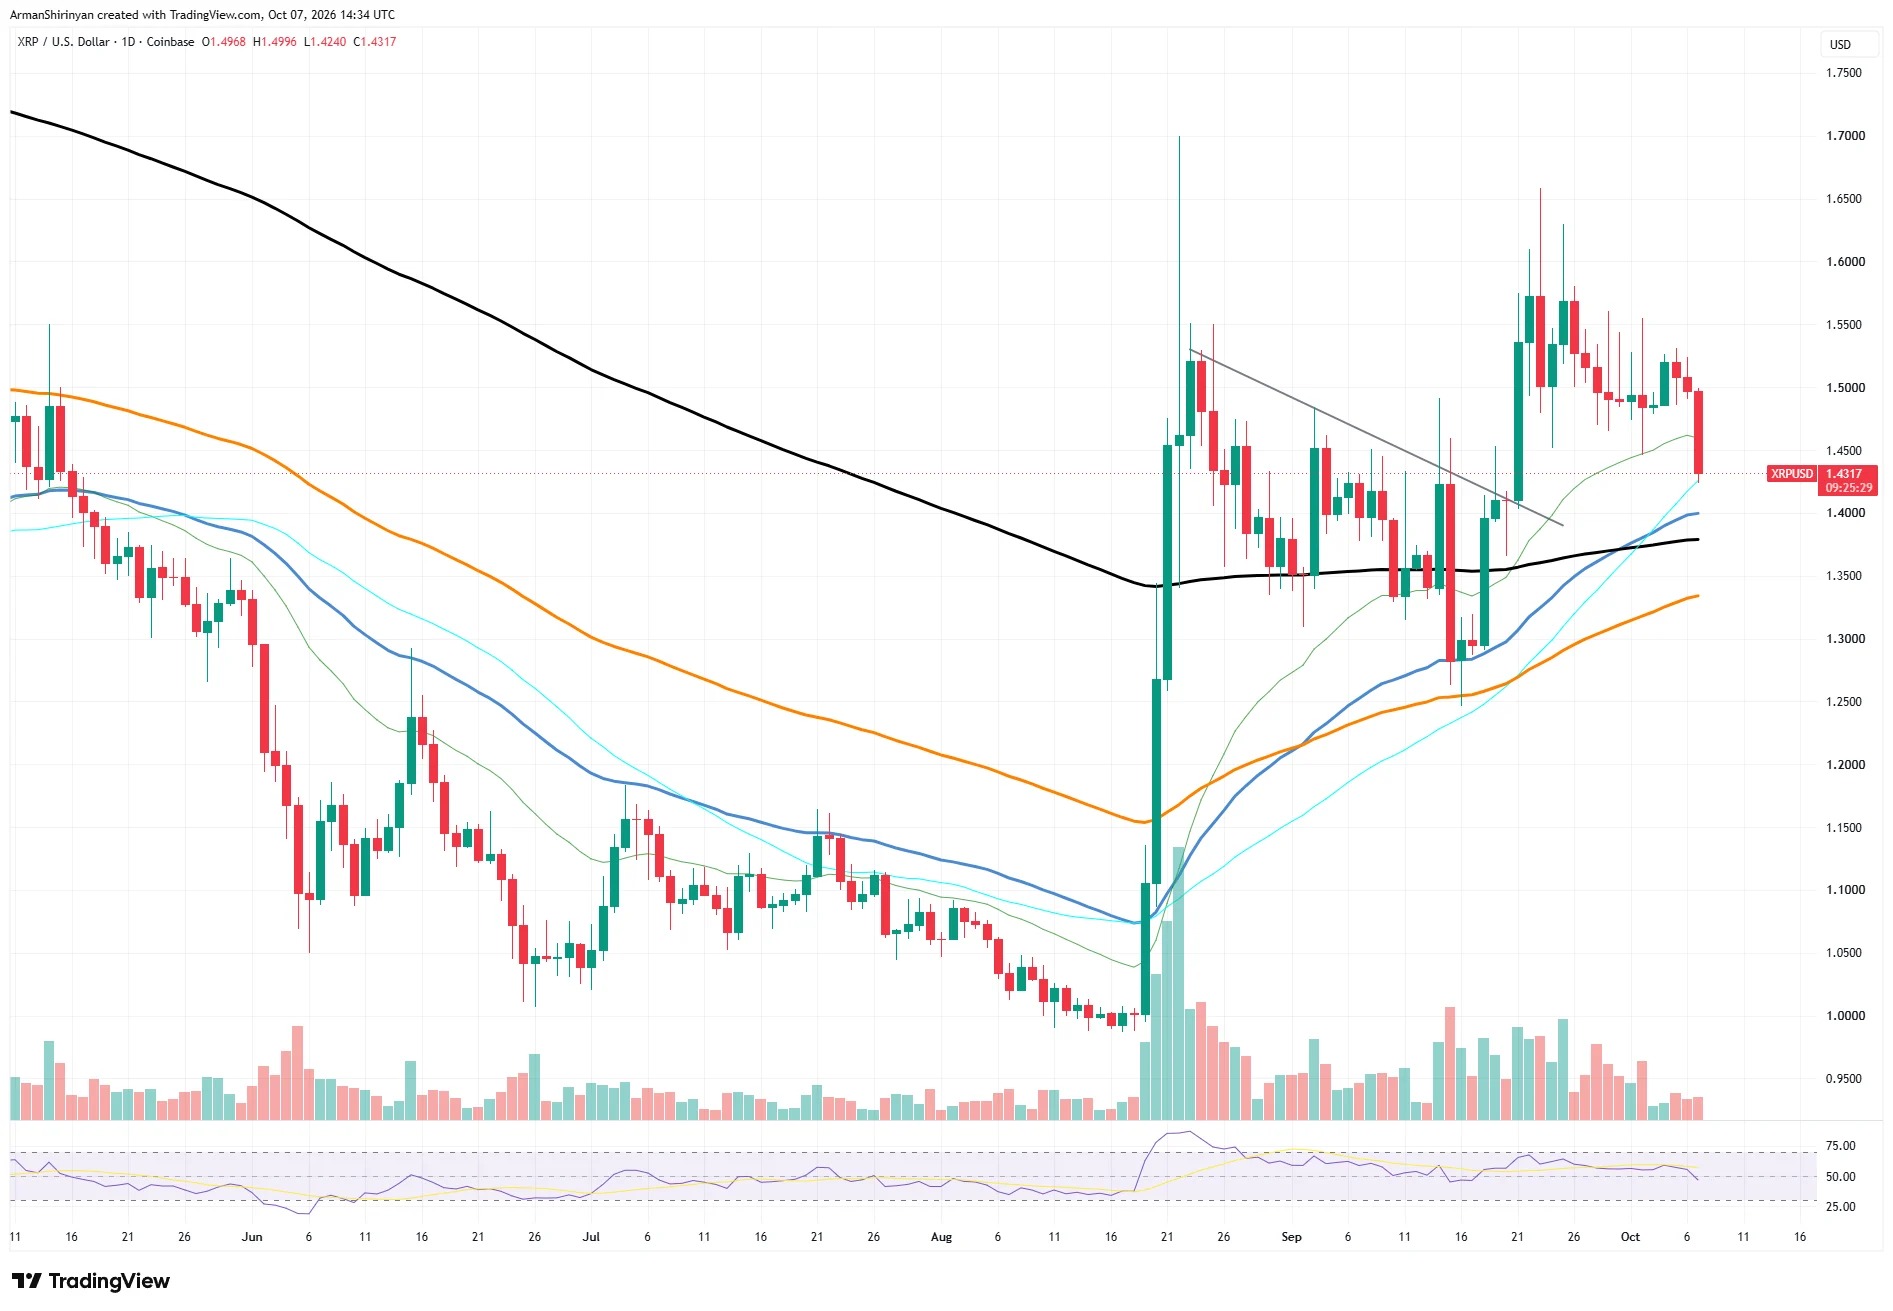
The current bullish scenario requires that XRP first re-establish itself above $1.45. If it can return above $1.50, it will more strongly indicate that the previous decline was merely temporary; whereas the range of $1.55–$1.60 remains a larger resistance zone.
Prior to this, the short-term structure of XRP was still biased towards the sellers, and the support range of $1.37–$1.40 was likely to determine whether a larger-scale rebound could be maintained intact.
Zcash Can it stabilize?
Zcash is attempting to stabilize after one of the strongest upward movements among mainstream cryptocurrencies, which has now turned into a clear correction. ZEC is currently trading at around $1,325, which represents a decline of about 22% from the recent high of around $1,700.
The amplitude of this cycle adjustment is not small, but the larger-scale technical structure has not collapsed. Since rising from around $500 in August, ZEC remains significantly above the medium- and long-term moving averages. The issue lies in the significant change in short-term momentum.
After rising to the range of $1,650–$1,700, ZEC formed a series of lower highs and lower lows, eventually falling back to around $1,300. The short-term moving average is currently around $1,320–$1,330, which has become the current battleground between bulls and bears. RSI has also fallen below the neutral 50-level area, confirming that most of the bullish momentum has dissipated.
Therefore, the range of $1,280–$1,300 is of critical importance. If the daily chart closes firmly below this range, a pullback could extend to $1,200–$1,170, where the next set of ascending moving averages will provide stronger structural support. If this area is lost, it will become increasingly likely for prices to move closer to $1,000.
To resume its upward trend, ZEC first needs to regain the level of $1,400. Above that, the range of $1,450–$1,500 represents the next major resistance zone. Only by consistently breaking above $1,550 will the recent highs once again come into sight.
ZEC is still in an upward trend on a larger scale, but the market has clearly entered a correction phase. Holding above $1,300 could lead to another rebound; failing to hold that level would significantly deepen the correction.
Ethereum experiences an unexpected decline
Ethereum recorded a clear daily decline, falling from near $2,700 during the session to around $2,560. This move broke the relatively narrow consolidation range of around $2,650–$2,750 that has been in place since late September for ETH.
The technical damage is already evident. ETH has fallen below the upward short-term moving average around $2,630, and RSI has also rapidly declined to the lower half of the neutral range. At the same time, the trading volume of this large negative candlestick is higher than that of the previous few trading days, further reinforcing the bearish signal for the short term.
However, Ethereum is approaching an even more important support level. The range of $2,500 to $2,520 coincides with the rising medium-term moving average and also served as a resistance level in September; therefore, this is the key area that could potentially stop the downward trend first.
If the level of $2,500 can be held, ETH may attempt to regain $2,600 and once again challenge the range of $2,680–$2,700. If it manages to return above $2,700, the current bearish trend will generally be neutralized, although $2,780–$2,800 will still represent a major upward resistance.
If the daily chart falls below $2,500, the pattern will clearly weaken. The next meaningful support level is around $2,400–$2,450, followed by the $2,300–$2,350 range, which contains slower long-term moving averages.
Therefore, Ethereum's larger-scale rebound is still intact for now, but there is not much room left for buyers. The reaction around $2,500 will determine whether the current trend is just a normal correction or if it will evolve into a larger-scale bearish reversal.