


Bitcoin started October 2026 on an upward trend, with three consecutive months of gains, and saw a 6.33% increase in September, achieving the second strongest performance for September in history. Therefore, the narrative of “Uptober” is supported by statistical data. Subsequently, on October 7th, the Federal Reserve released the minutes of its September meeting, and Bitcoin fell below $83,000 within a few hours, resulting in a net outflow of $484.9 million on that single day (“ETF”). This pattern does indeed exist, but there are also real variables that can influence it. The following is a data-driven analysis of both phenomena.
Statistical records
According to Coinglass data, in the 13 years from 2013 to 2025, Bitcoin had 10 months of gains in October, showing a relatively high monthly win rate. The average return over these 13 years was 18.52%, with a median of 12.73%.
The gap between the average value of 18.52% and the median of 12.73% is structurally significant. The significant increases in October 2013 (60.79%), October 2021 (39.9%), and October 2023 (28.52%) tend to significantly raise the average value, so the median better represents the typical results for an ordinary October.
As of the end of the month, there are nearly 20 days left until the closing of Bitcoin prices, and it is still uncertain whether the price will close higher or lower; however, historical data from 2013 to 2025 indicates that the outcome tends to be a higher closing price.
What actually happened in October 2025?
October 2025 is the most important data point for the “Uptober” pattern, not because of its decline, but rather under what conditions it turned downward. Bitcoin rose from $103,856 to $126,080 during that month, with a monthly volatility range of 21%, but ultimately closed down 3.92%. After reaching a historical high of $126,198 on October 29th, it then fell back.
U.S. spot Bitcoin ETF recorded a net inflow of approximately $4.7 billion in October 2025. This was the largest monthly ETF capital attraction since its launch in January 2024, yet it still could not prevent a monthly decline. Despite record buying by institutions, the month ended in the red due to the pressure from Sino-U.S. trade tensions and the need for leveraged long positions to be closed, which outweighed the capital inflows.
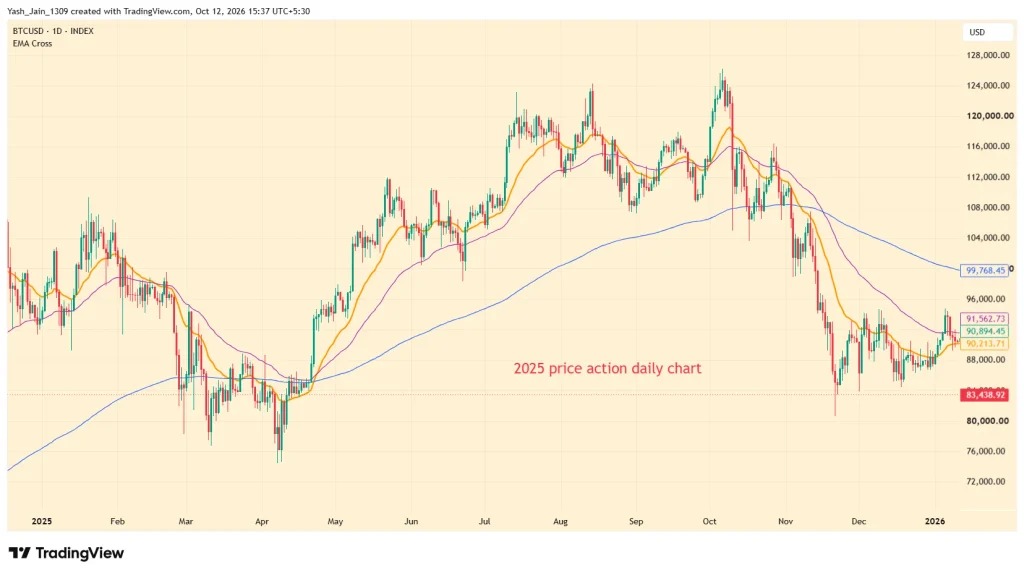
October 2025 also marks the seventh consecutive year that Bitcoin enters the month with both the benefits of a halving and the demand-driven support from ETF. The previous six consecutive rises all occurred in an environment where institutional selling was limited or absent. The breakthrough in 2025 confirms that there is a seasonal pattern that exceeds macroeconomic thresholds; however, the inflow of ETF alone does not constitute an unconditional bottom.
October 2026: Current Landscape
Price and entry position
In early October 2026, Bitcoin was trading around $84,000, which is 33.4% lower than its intraday high of $126,198 in October 2025. In the three months prior to October, Bitcoin saw consecutive gains: it rose 25% in August and 6.33% in September, and once again managed to surpass both the 50-week moving average and the 200-week moving average.
A gain of 6.33% in September 2026 represents the second-highest return for Bitcoin in September, only behind the 7.29% recorded in September 2024. Historically, entering October with a "record-breaking second-strongest September" has usually led to a positive October, but the sample size for this combination is limited.
On October 1st, Citibank raised its 12-month target price for Bitcoin from $82,000 to $113,000, citing ETF renewed demand, an increase in the number of advisory and brokerage accounts, and an improvement in the macroeconomic environment. This adjustment led to institutional valuations of Bitcoin exceeding $100,000 being officially recorded on the first trading day of October.
ETF Capital Flow Reversal
U.S. spot Bitcoin ETF recorded a net inflow of $102.7 million on October 1st and $189.9 million on October 2nd. After the Federal Reserve released the minutes of its September meeting on October 7th, ETF experienced a net outflow of $484.9 million in a single trading day, which was the largest single-day withdrawal in over three months, erasing all the inflows accumulated during the first four trading days of October.
Looking at the fund-level data from October 1st to October 8th, there was a clear divergence within ETF. BlackRock’s IBIT saw a net inflow of $332.5 million during this period; Fidelity’s FBTC experienced a net outflow of $408.1 million; 21Shares’ ARKB had a net outflow of $214.9 million. The total net outflow for all spot Bitcoin ETF in the United States amounted to $407.4 million. Although IBIT continued to attract funds, the overall figure still turned negative.
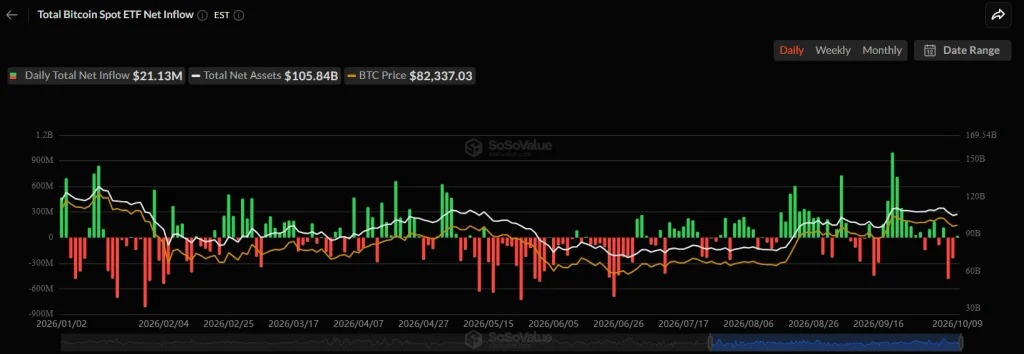
After Bitcoin fell below $83,000, the average ETF position was slightly in a loss-making state, with institutional costs estimated to be in the range of $82,000 to $85,000.
Fed Variable: October 28th
The Federal Reserve's meeting on October 27-28, FOMC, is the single calendar event in October 2026 that will have the greatest impact on Bitcoin. On September 16, the Federal Reserve raised interest rates by 25 basis points, setting the target range at 3.75% to 4.00%. The minutes of the September meeting, released on October 7, indicated that most officials still believed it was appropriate to raise rates once more this year.
As of October 1st, CME FedWatch indicated a 47.1% probability of a 25-basis-point interest rate hike in October, which is lower than the 70.9% from the previous week. By October 8th, this probability further dropped to around 18%. The weaker non-farm payroll report for September contributed to this downward revision in expectations.
The inflation data for PCE released on October 29th is the Fed's preferred inflation indicator, and its release was a day later than the decision regarding FOMC. If the PCE data proves to be on the high side following the decision to maintain interest rates unchanged, the market will immediately reprice its expectations for a rate hike in December. The consecutive events from October 28th to 29th represent the most concentrated macroeconomic risk period Bitcoin has faced in a single month since the "dual events" of September 16th.
Statistical Judgment: Patterns and Structures
Halving cycle issue
In the month of October, when Bitcoin experienced 10 upward moves, 5 of them occurred within 12 months after a halving: in 2013 (after the 2012 halving), 2016 (after the 2016 halving), 2020 (after the 2020 halving), 2021, and 2024. In April 2024, the halving reduced the block reward from 6.25 BTC to 3.125 BTC. As of October 2026, 30 months have passed since the last halving, and we are no longer in the seasonal period where supply scarcity related to halvings drives price increases.
ETF Structural Changes
The US spot Bitcoin ETF market did not exist before January 2024. Today, these 12 funds collectively manage assets of approximately $105 billion. ETF holders and the institutional investors behind them have clear cost thresholds, quarterly reporting requirements, and drawdown limits, which retail buyers do not have. October 2025 has proven that a flow of $4.7 billion into ETF could also be offset by large-scale forced liquidations.
Octagonai's market forecast data at the beginning of October indicated that the probability of Bitcoin breaking through $100,000 in October 2026 was 13%, a significant drop from 85% a week earlier, with a re-pricing of nearly 72 percentage points within 7 days. The triggering factor was the minutes from the Federal Reserve meeting. Seasonal patterns are unable to account for such a binary re-pricing, but market forecasts can, and they responded immediately.
The win rate of this strategy in 2013 was 76.9%, which is quite stable historically. From 2013 to 2024, there has never been a situation where an interest rate hike occurred in the same calendar month as the FOMC meeting in October, and at the same time, Bitcoin's price increase over the past 12 months was less than 5%. October 2026 is the first time in the sample period that all three conditions are met: the end of a halving cycle, the presence of institutional ETF, and a real Federal Reserve interest rate decision within that month.
As of October 12th, what data is supported?
As of October 12, Bitcoin has been trading in the range of around $82,300 to $84,500 after a decline on October 8. ETF There was a net outflow of $407.4 million this month. FOMC There are still 18 days until the meeting. PCE There are also 19 days left until the data is released. The CPI on October 14 is the next piece of immediate macro data that could drive a two-way change in the probability of an interest rate hike in October.
A structural analysis released by Investing.com on October 9th indicated that approximately 45% of Bitcoin's increase in the third quarter had pushed the price to major technical resistance levels. Historically, when the market enters a traditionally strong month at technical resistance levels and there is a real Federal Reserve binary event, the trend does not directly follow the seasonal average; instead, it first tests the support levels.