WF Holding ( WFF ) The daily chart structure indicates a bullish trend, but short-term signals are divergent. As of 2:59 p.m. Eastern Time, the stock price of WF was at $36, above the upper band of its daily and hourly Bollinger Bands. The main contradiction at present is that both the daily and hourly charts show overbought conditions, yet the price at the 15-minute level is still below nearby reference points.
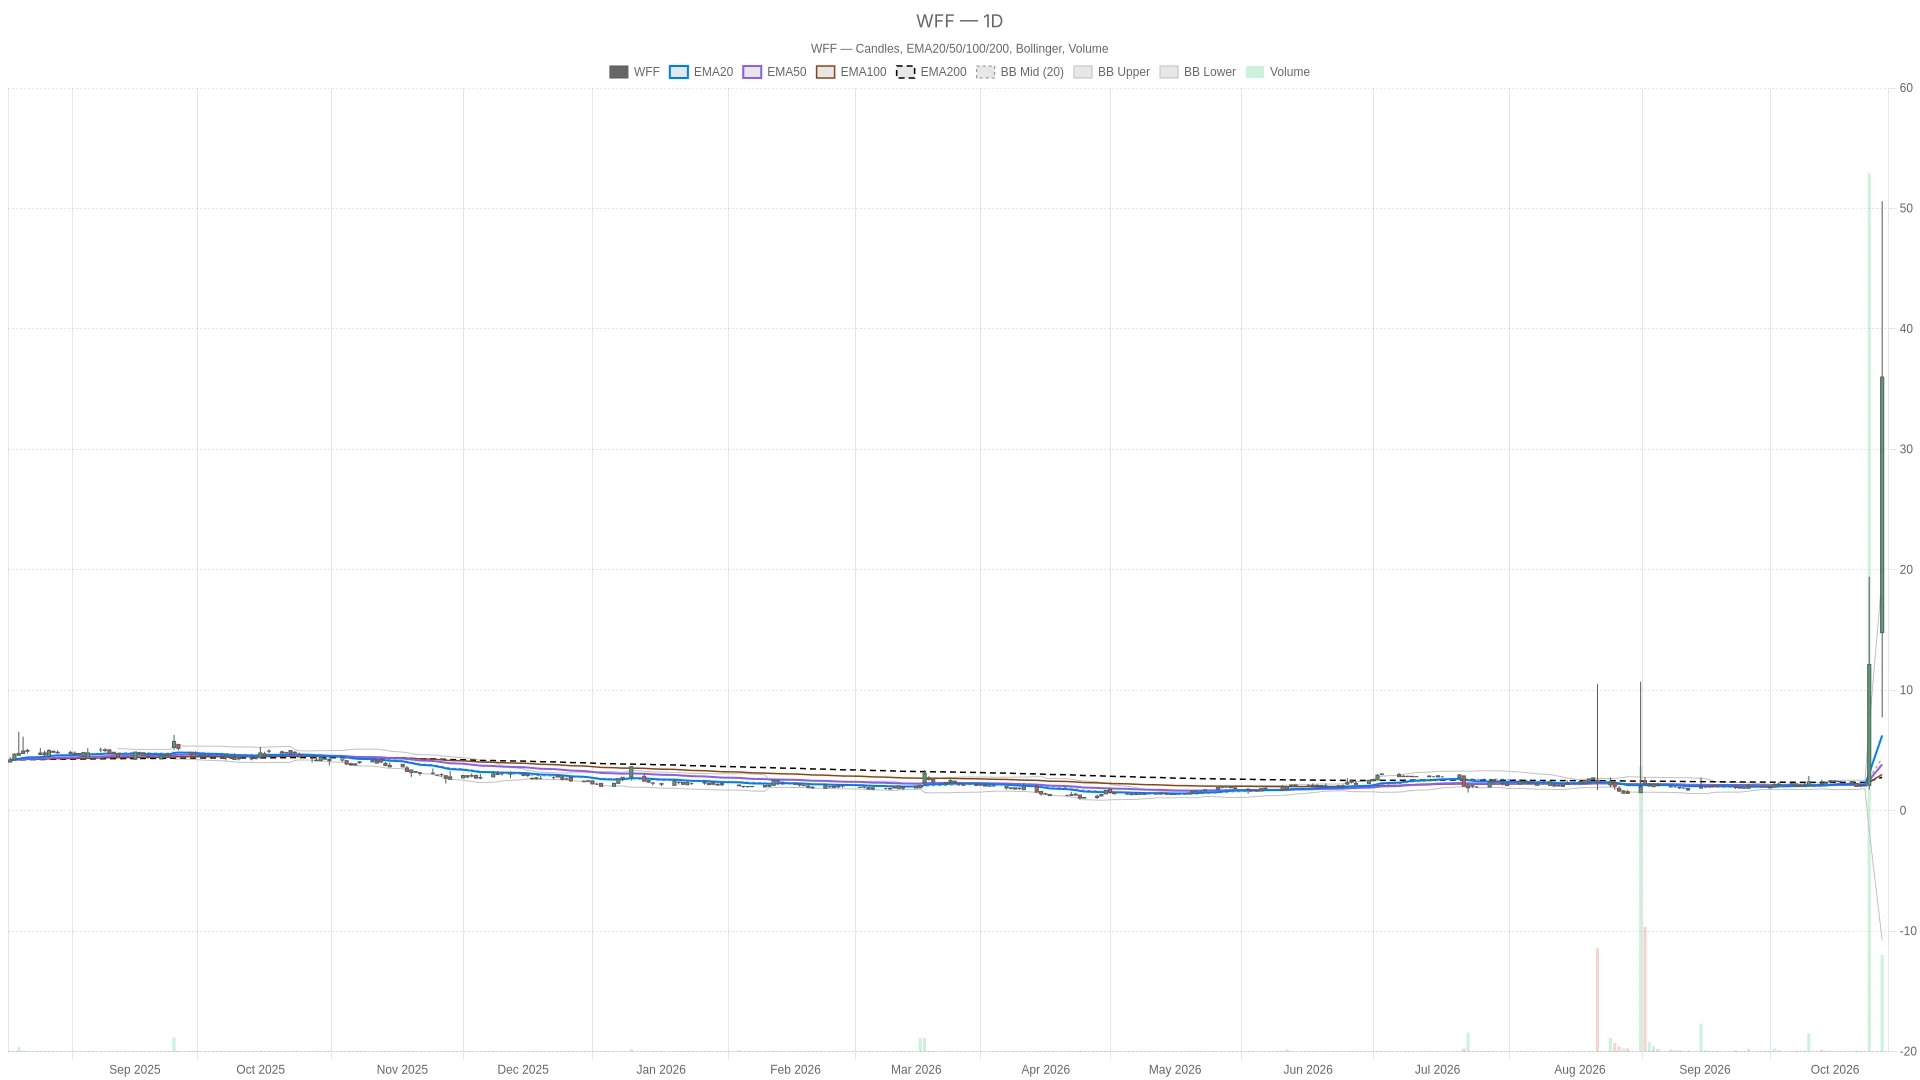
The Japanese candlestick opened at $14.78, hit a low of $7.75 during the session, a high of $50.60, and the latest price is $36.00, with the previous closing price being $12.13.
Key Points
- The daily line RSI14 is at 97.86, which is clearly in an overbought range; the hourly line RSI14 is at 75.78.
- The stock price is above the upper band of the daily Bollinger Bands at $19.52, as well as above the upper band of the hourly Bollinger Bands at $32.49.
- In the past 15 minutes, RSI14 fell from 73.54 to 66.16, below the overbought threshold.
- The daily chart ATR14 rose from $1.54 on the previous trading day to $4.49, reflecting increased volatility.
Daily chart: The structure indicates a bullish trend, but indicators show overbought conditions.
The daily chart indicates a bullish trend for the stock WF. The stock price is above the 20-day EMA (6.25 USD), and the 20-day EMA is in turn higher than the 50-day EMA (3.85 USD), which supports a bullish outlook. The stock price is also above the 200-day EMA (3.78 USD) on the daily chart.
At the same time, the daily line RSI14 is at 97.86, which is clearly in an overbought area. The daily line MACD is at 3.34, which is 0.83 higher than the signal line, and the bar chart shows a positive value of 2.5. These readings support positive momentum, but RSI does not indicate how long this state will continue.
It is worth noting that the stock price is above the upper Bollinger Band level of $19.52 and the middle band level of $4.38 on a daily chart, as well as above the first resistance level of $20.46 and the pivot point of $11.11 on the same chart. Currently, these levels are below the current price, making them more akin to reference points below rather than obstacles above.
In addition, the daily line ATR14 rose from $1.54 on the previous trading day to $4.49, indicating an increase in the calculated daily volatility. The text points out that the daily indicators include the trading period of the current day that has not yet closed, therefore the current reading is not the final value.
Hourly chart: bullish arrangement, but there is still resistance above.

The hourly chart confirms the bullish trend at the daily level of WFF. The stock price is above the 20-hour EMA (14.54 USD), 50-hour EMA (8.23 USD), and 200-hour EMA (3.83 USD); this complete arrangement indicates a bullish situation. The hourly chart RSI14 shows a value of 75.78, which is also in the overbought range.
In addition, the hourly line MACD is at 6.76, which is higher than the signal line of 4.05, and the bar chart shows a positive value of 2.71. The stock price is above the upper band of the hourly Bollinger Bands at 32.49 dollars and the hourly pivot point at 27.5 dollars. However, the first resistance level of the hourly line at 38.06 dollars is still above. The hourly line ATR14 is at 6.4 dollars.
15-minute chart: Support tests make entry points more complex
In contrast, the 15-minute chart complicates the timing of trade execution without overturning the daily perspective. The stock price is below the first support level of $37.70, as well as below the upper Bollinger Band of $39.39 and the pivot point of $39.41.
At the same time, the 15-minute MACD line is at 5.3, which is still higher than the signal line of 3.35, and the bar chart shows a positive value of 1.94. The stock price is also higher than the 15-minute EMA lines, which are arranged in a bullish pattern, at 22.84 USD, 15.9 USD, and 7.1 USD respectively. Therefore, the current conflict point is clear: the indicator position is on the positive side, but the price is below the short-term support level and the pivot reference point. The 15-minute ATR14 is at 5.38 USD.
Key Price Levels and Conditional Scenarios
To continue the upward trend, the price needs to re-establish itself above the 15-minute first support level of $37.70 and break through the hourly first resistance level of $38.06. Subsequent upper reference levels include the 15-minute Bollinger Band upper band at $39.39 and the pivot point at $39.41. Further up, after the 15-minute first resistance level of $42.81, comes the daily high of $50.60.
Conversely, if it falls below the upper band of the hourly Bollinger Bands at $32.49, it will weaken the short-term bullish argument. Further support levels include the hourly pivot point of $27.50 and the first support level of $22.22. If it also falls below the daily first resistance level of $20.46 and the upper band of the daily Bollinger Bands at $19.52, then that would undermine the judgment of a continuation of the bullish trend.
Volatility and the Context of the News
The daily line ATR14 is at $4.49, the hourly line ATR14 is at $6.4, and the 15-minute line ATR14 is at $5.38.
In the reports released on October 11th (Sunday) and those before the market opened on Monday, Yahoo Finance included WFF in the list of stocks for close attention.
Overall, the stock price of WF is above the upper band of the Bollinger Bands on both the daily and hourly timeframes, but it is still below the hourly resistance level of $38.06 and the 15-minute pivot point of $39.41. The unresolved question is whether the price will be able to break through these near-term obstacles before the end of the day's trading. It is mentioned in the text that the price and technical indicator data are sourced from Twelve Data.
Frequently Asked Questions
What is the current price of WF stock?
As of 2:59 p.m. Eastern Time on Monday, October 12, 2026, the stock price of WF was reported at $36, representing a 196.78% increase from the previous closing price of $12.13.
WF Is the stock in a overbought state?
The daily line RSI14 is at 97.86, and the hourly line RSI14 is at 75.78, both of which are above the overbought threshold of 70. However, the 15-minute line RSI14 has dropped from 73.54 to 66.16, falling below the overbought threshold.
Where is the key resistance level for WFF?
The first resistance level on the hourly chart is at $38.06. On the 15-minute chart, the upper Bollinger Band is at $39.39, the pivot point is at $39.41, and the first resistance level is at $42.81. The highest price of the day was $50.6.
Where is the key support level for WFF?
The first support level within 15 minutes is $37.70. Below that, the upper band of the hourly Bollinger Bands at $32.49, the hourly pivot point at $27.50, and the first hourly support level at $22.22 can all serve as reference levels for downward movement.
Neither Cryptonomist nor the author holds any positions in the financial instruments mentioned in this text, nor have they received any compensation from the companies reported.
This article was generated with the assistance of artificial intelligence and has been reviewed by an editorial team.