AAPL Stocks still maintain a bullish trend on the daily chart, with prices above the exponential moving average. The daily MACD line is also higher than the signal line. However, the readings on the hourly and 15-minute charts RSI are in an overbought zone, complicating the short-term structure. The daily chart structure supports a bullish outlook, but the execution signals are rather mixed.
Key Points
- As of 10:46 a.m. Eastern Time on Tuesday, the stock of AAPL was trading at $345.98, up 1.47% from its closing price of $340.97 on Monday.
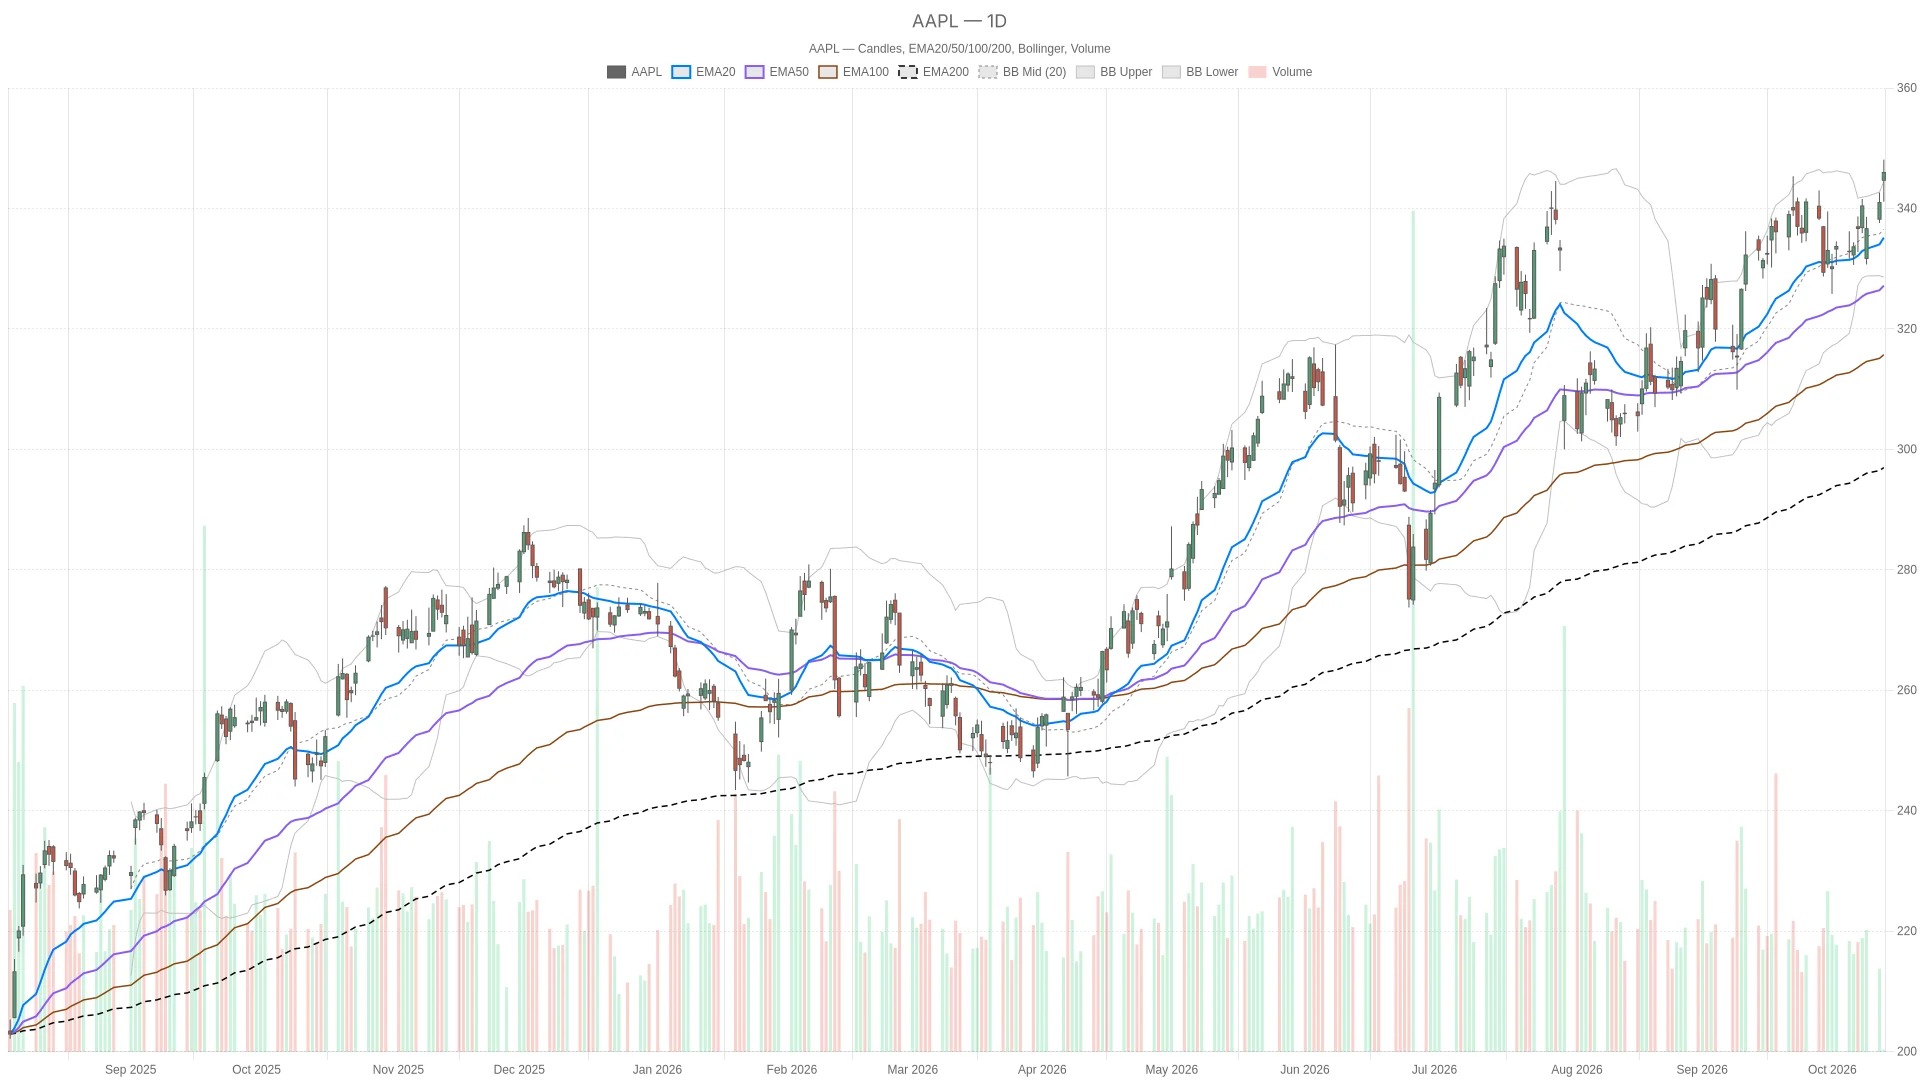
- The daily chart EMA shows a bullish pattern and is located below the price: the 20-day moving average is $335.16, the 50-day moving average is $327.19, and the 200-day moving average is $297.49.
- The daily chart RSI14 is at 64.34, below the overbought area; the hourly chart RSI14 has dropped from 72.69 to 70.53; the 15-minute chart RSI14 has fallen from 80 to 78.99.
- The price is above the upper band of the daily Bollinger Bands at $344.44, the daily pivot point at $340.4, and the first daily resistance level of R1 at $343.2.
- On the hourly chart MACD, the bar chart rose from 0.6 to 0.74; on the 15-minute chart MACD, the bar chart fell from 0.63 to 0.58.
On Tuesday, October 13, 2026, Apple opened at $344.68 and fluctuated between $341.12 and $348.11 during the session. As of 10:46 Eastern Time, the stock price was at $345.98, representing a 1.47% increase from the previous closing price of $340.97 on October 12, 2026. Since the trading session has not yet ended, the daily chart indicators include the candlesticks that are still forming.
AAPL Stocks maintain a bullish daily structure

The daily chart supports a bullish trend for the AAPL stock. The price is above all three exponential moving averages, with the MACD line being higher than the signal line. The 20-day EMA average is at $335.16, the 50-day EMA average is at $327.19, and the 200-day EMA average is at $297.49. This arrangement supports a mainly bullish outlook, not just the fact that the price is above one of the moving averages.
At the same time, the daily line RSI14 is at 64.34, which is above neutral but still below the overbought area. The daily line MACD is at 4.16, higher than the signal line of 3.89, and the positive value in the bar chart is 0.27. Both of these readings support the judgment that the market is on the upside. Additionally, the daily line RSI has not entered the overbought zone.
The price is still above the upper band of the daily Bollinger Bands at $344.44. The middle band is $336.52, and the lower band is $328.59. This means that the price has broken through the upper band during the session, so the position of the Bollinger Bands can provide reference for whether this bullish structure can continue. The daily ATR14 is at $6.72, which provides a context for volatility rather than a directional signal.
It is worth noting that the price is above the daily pivot point of $340.4 and the first daily resistance level of $343.2 ($R1). The first daily support level ($S1) is at $338.17. These levels are derived from the previous completed daily candlesticks and are applicable to the current trading session.
On the hourly chart, there is a confirmed bias to the upside, but the execution signals are mixed.
The hourly chart confirms a bullish bias on the daily chart. The price is above the bullish levels of 20-hour EMA at $339.71, 50-hour EMA at $337.39, and 200-hour EMA at $330.4. It is also above the hourly chart pivot point of $345.25 and the upper band of the Bollinger Bands at $345.88.
However, on the hourly chart RSI14, the price has dropped from 72.69 to 70.53 from the previous candlestick, still remaining in the overbought area. On the hourly chart MACD, the bar chart shows an increase from 0.6 to 0.74, and on the chart MACD, line 2.1 is higher than the signal line at 1.36. These changes present a mixed signal: there is a decline indicated by RSI, but the positive gap between line MACD and the signal line remains significant.
The 15-minute chart RSI14 shows a value of 78.99, which is below the pivot point.
On the 15-minute chart, RSI14 has dropped from 80 to 78.99, still remaining in the overbought area. The bar chart for MACD has decreased from 0.63 to 0.58, but the line for MACD at 1.8 is still above the signal line of 1.23. This makes short-term timing more complex, but it does not overturn the overall bullish judgment for the daily chart.
At the same time, the price is below the pivot point of 346.16 USD on the 15-minute chart, but above the first support level of 345.38 USD on the same chart. The upper band of the Bollinger Bands on the 15-minute chart is at 346.71 USD, followed by the first resistance level at 346.77 USD. The hourly chart ATR14 indicates a level of 2.27 USD, while the 15-minute chart ATR14 shows a level of 1.35 USD. These levels represent the volatility of their respective time frames.
Product News and Valuation Comments for Tuesday
On Tuesday, product news and valuation comments regarding the stock of AAPL began to appear one after another. During trading hours, Yahoo Finance reported that Apple had released HomeView and discussed its prospects in the smart home market.
In addition, the pre-market reports mentioned observations that BofA has seen a reduction in waiting times for iPhone, Pro, etc. Yahoo Finance indicated that the shorter delivery cycles have raised questions regarding the demand for iPhone.
In contrast, Seeking Alpha published an article during trading hours, questioning the valuation of Apple. Investing.com also reported on Tuesday during trading hours that Apple's stock price reached a new historical high of $345.45. These reports provide the context.
Bullish and bearish conditions
For the bullish scenario of AAPL stock, it is required that the intraday structure remains stable. The price must remain above the pivot point of 345.25 USD on the hourly chart and above the pivot point of 346.16 USD on the 15-minute chart. If it further breaks through the upper band of 346.71 USD on the 15-minute chart and the first resistance level of 346.77 USD, this scenario will be supported. Further upwards, after the intraday high of 348.11 USD, there is the first resistance level of 349.39 USD on the hourly chart.
On the contrary, if it falls below the first support level of 345.38 USD on the 15-minute chart and the pivot level of 345.25 USD on the hourly chart, that would weaken the current bullish outlook. The next set of reference levels below are the upper band of the daily Bollinger Bands at 344.44 USD, the first resistance level of the daily chart at 343.2 USD, and the first support level of the hourly chart at 342.4 USD. A further decline below the daily pivot level of 340.4 USD would challenge even broader support levels, with the first daily support level at 338.17 USD located below that.
Overall, the AAPL stock is still above the daily moving average and the pivot point on the hourly chart, but below the pivot point on the 15-minute chart. The daily ATR14 level is at $6.72, making volatility a key factor in the assessment. The issue that has not yet been resolved is whether the bullish daily structure can coexist with the overbought intraday readings when the trading session has not yet ended.
Prices and technical indicators are from Twelve Data.
Frequently Asked Questions
What is the daily trend structure of AAPL stock?
There are many daily line structures. The 20-day EMA (335.16 USD), 50-day EMA (327.19 USD), and 200-day EMA (297.49 USD) lines are arranged in a bullish pattern below the price level. The daily MACD line is at 4.16, which is higher than the signal line of 3.89, and the bar chart shows a positive value of 0.27. The daily RSI14 line is at 64.34, still below the overbought area.
Is the intraday RSI of AAPL stock in a state of overbought?
Yes. The hourly chart RSI14 shows a value of 70.53, which has fallen from 72.69 but is still in the overbought area. The 15-minute chart RSI14 shows a value of 78.99, also down from 80, and is in the overbought zone as well. However, the bar chart for the hourly chart MACD has risen from 0.6 to 0.74, while the bar chart for the 15-minute chart MACD has dropped from 0.63 to 0.58, so the trading signals are rather mixed.
Which key levels of the AAPL stock need to be monitored?
The price is above the daily pivot point of $340.4, the daily R1 of $343.2, and the upper band of the daily Bollinger Bands at $344.44. On the hourly chart, the price is also above the pivot point of $345.25. However, it is below the 15-minute chart pivot point of $346.16. Key support levels include the 15-minute chart S1 of $345.38, the hourly chart S1 of $342.4, and the daily S1 of $338.17.
What are the news releases regarding AAPL stock on Tuesday?
During trading hours on Tuesday, Yahoo Finance reported on the release of Apple's HomeView, while Seeking Alpha raised doubts about Apple's valuation. Investing.com noted that Apple's stock price reached a new historical high of $345.45. Before the market opened, Yahoo Finance mentioned that BofA observed a reduction in the waiting time for iPhone at 18 Pro, which sparked questions about demand. These reports provide the context.
Cryptonomist and the author do not hold any positions in the financial instruments mentioned in this text, nor have they received any compensation from the companies covered.
This article was generated with the assistance of artificial intelligence and has been reviewed by an editorial team.