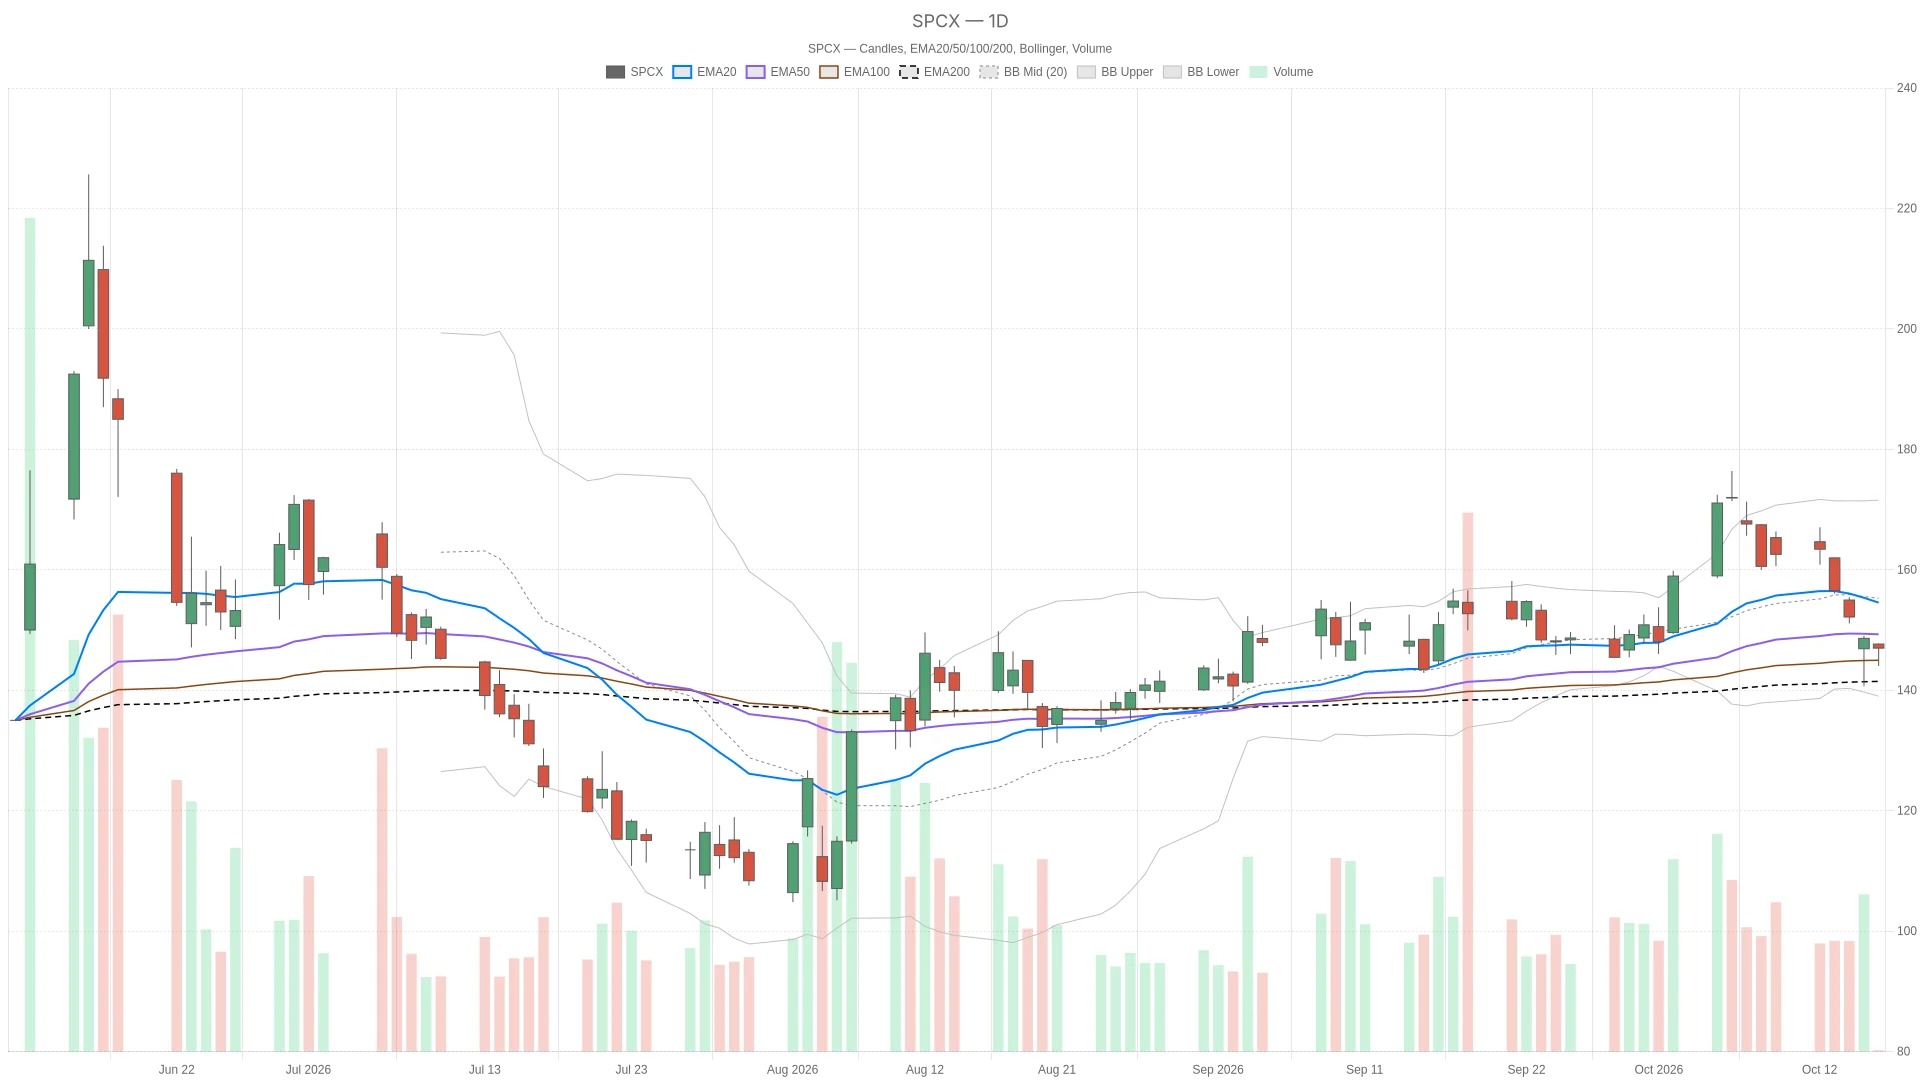
Although the short-term MACD bar chart shows a positive trend, the daily chart of SpaceX stock still tends to be bearish. SpaceX is traded using SPCX code, and the price is still below the daily moving average. Intraday signals make this judgment more complex, but they are not sufficient to override the daily chart structure.
Key Points
- As of 10:47 a.m. Eastern Time on Friday, SPCX was trading at $146.99, down 1.1% from the previous trading day's closing price of $148.62.
- The daily line RSI14 is at 44.08, which is below the neutral threshold of 50.
- The daily chart MACD bar chart shows -1.89, and the MACD line shows 1.74, which is below the signal line of 3.63.
- The price is below $154.56 for 20 trading days EMA and below $150.59 for 50 trading days EMA.
- Hourly chart MACD The bar chart has changed to 0.01, which is higher than the previous K-line value of -0.11.
On Friday, October 16, 2026, SPCX opened at $147.67, with a low of $144.04 and a high of $147.80 during the session. As of 10:47 Eastern Time, SPCX was trading at $146.99, representing a 1.1% decline from the previous closing price of $148.62 on October 15. SPCX opened at $147.67 and fluctuated between $144.04 and $147.80 during the session, with the latest price at $146.99.
SpaceX Stock: The daily chart structure indicates a bearish trend.
On the daily chart, over 50 trading days EMA, the price was 150.59 US dollars, which is lower than 154.56 US dollars over 20 trading days EMA. The price is at 146.99 US dollars, below both of these moving averages, hence forming resistance above, rather than a perfectly consistent bearish moving average structure.
Meanwhile, the daily line RSI14 is at 44.08, which is below the neutral level of 50, but still above the oversold range. The daily line MACD is at 1.74; although it is positive, it is lower than the signal line of 3.63. The negative bar chart with a value of -1.89 further reinforces the bearish judgment for the daily line, but this does not mean that all momentum indicators are negative.
It is worth noting that the middle band of the daily Bollinger Bands is at $155.29, the lower band at $139.01, and the upper band at $171.56. Since the price is located in the lower half of this range, the middle band serves more as a reference above rather than a support level.
Hourly signals complicate daily line analysis.
However, the hourly chart is not overwhelmingly bearish. The RSI14 for the hour is 36.63, which is below 50 but still above the oversold threshold.
It is worth noting that the bar chart for the hour MACD has risen from -0.11 to 0.01 compared to the previous K-line. This positive reading provides a limited offset to the negative bar chart on the daily time frame.
However, the price is still lower than $150.89 for 20 hours, $153.26 for 200 hours, and $155.48 for 50 hours. This positional relationship supports a bearish judgment for the daily chart.
Even so, the confirmation of the hourly bar chart alone does not establish a bullish price structure. At the same time, the price is above the hourly pivot point of $146.01 and below the first hourly resistance level ( R1 ) of $147.99. The first hourly support level ( S1 ) is at $144.23. These reference levels define the current hourly structure but do not change the daily level.
Short-term timing points and news context
On the 15-minute chart, the price is below the 20-week EMA of $147.21 and the 50-week EMA of $149.09, as well as below the 200-week EMA of $156.10. This indicates that the price arrangement over this period is bearish relative to the moving averages.
On the contrary, after 15 minutes, the MACD line is at -0.41, which is higher than the signal line of -0.54, forming a positive bar chart with a value of 0.13. The RSI14 is at 48.36, still below 50. These mixed readings provide a background at the execution level, but they do not serve as a reason to replace the daily trend.
The 15-minute pivot point of $146.79 is below the current price, while the first resistance level ($R1) of $147.58 is above it. The middle band of the 15-minute Bollinger Bands is also at $146.99, which is in line with the current price. For the stock SpaceX, these nearby reference levels define the short-term trading dynamics at hand.
According to a report released on Thursday, October 15th, EU regulatory authorities are preparing to accelerate the anti-monopoly review of Project Bromo. The report described this project as a joint space venture by European companies aimed at competing with American satellite service providers. The same day's report also mentioned that some insiders were about to see their share restrictions lifted.
Bullish and bearish scenarios
A bullish scenario requires the price to first break through the 15-minute 20-period EMA of 147.21 USD, followed by a consolidation above the 15-minute first resistance level of 147.58 USD. If it further breaks through the hourly first resistance level of 147.99 USD, that will add support. More crucial resistance levels on the daily chart are the 50-trading-day EMA of 150.59 USD, the first resistance level of 151.55 USD, and the 20-trading-day EMA of 154.56 USD.
On the contrary, if it falls below the daily pivot point of $146.11, it will weaken the aforementioned bullish scenario. Below that, following the intraday low of $144.04, is the first daily support level at $143.17. If it further breaks below this support, the lower band of the daily Bollinger Bands at $139.01 will become a further reference for downward movement.
Overall, the price is above the daily pivot point but below both daily moving averages. Meanwhile, the daily ATR14 level is at $7.05, making volatility a key factor in assessing these levels. The unresolved issue is whether the positive values in the intraday MACD bar chart can occur simultaneously with a price break above the resistance level, rather than merely serving as an isolated reversal signal.
Frequently Asked Questions
SpaceX What is the daily trend structure of stocks?
The daily chart indicates a bearish trend. As of 10:47 Eastern Time, the price was at $146.99, which is lower than the $150.59 level over 50 trading days and the $154.56 level over 20 trading days. The daily indicator RSI14 shows a value of 44.08, which is below the neutral range of 50, and the bar chart for the daily MACD indicates a value of -1.89.What is the key support level for SPCX?
The daily pivot point of $146.11 provides near-term support, followed by the intraday low of $144.04 and the first daily support level ($S1) at $143.17. The lower band of the daily Bollinger Bands at $139.01 serves as a further reference for downward movement.SpaceX Which resistance levels do stocks need to break through?
On the 15-minute chart, the 20-period EMA level of $147.21 and the first resistance level of $147.58 are the immediate obstacles. The first resistance level on the hourly chart is at $147.99. More crucial daily levels include the 50-trading-day EMA level of $150.59, the first daily resistance level of $151.55, and the 20-trading-day EMA level of $154.56.Does the in-market signal support a judgment of bearishness on the daily chart?
Not completely consistent. The 1-hour MACD bar chart rises to 0.01, and the 15-minute MACD bar chart shows 0.13; both provide limited hedging. However, the price is still below all the moving averages on the hourly and 15-minute charts, which supports a bearish structure for the daily chart.Cryptonomist and the author do not hold any positions in the financial instruments mentioned in this text, nor have they received any compensation from the companies reported.
This article was generated with the assistance of artificial intelligence and has been reviewed by an editorial team.
Affected by the weak daily trend and the reversal at the hourly level, it fell by 0.72%.
CRWV Stocks fall 7.13%, trading at $64.72 as of 10:44 Eastern Time.
Get the latest news on cryptocurrencies and the entire blockchain world.
Selected Videos
QuantumScape Stocks rose by 7.63%, but still remain below three daily moving averages. EMA
Mastercard Global Money Platform Links fiat currencies with stablecoins into one system
Morgan Stanley The tokenized assets market is expected to reach $3 trillion to $10 trillion by 2030.
XRP is still below all daily moving averages; the rebound lacks confirmation.