

Key Points
- NEAR fell 7% on Tuesday, closing at around $4.70, continuing the downward trend from Monday.
- Bitwise's NEAR ETF attracted $5.42 million in capital inflows on Monday, following three consecutive weeks of net inflows.
- To enhance the rebound prospects, NEAR must once again reach the resistance level of around $5.02.
Despite ETF continuing to buy, NEAR still fell back.
Due to the weakening of short-term momentum offsetting the continuous demand through exchange-traded funds, NEAR Protocol fell by more than 7% on Tuesday, and recorded a similar decline the previous day as well.
As of the time of this article's publication, the token is trading at around $4.70, which is still below a series of dense resistance levels near $5.02.
According to SoSoValue data, ETF NRR, which focuses on NEAR under Bitwise, recorded a net inflow of $5.42 million on Monday. The previous purchases occurred after three consecutive weeks of net inflows, with a cumulative total of over $80 million.
NEAR emphasized the growth of its multi-chain transaction infrastructure in its third-quarter report for 2026, released on Monday.
The cumulative trading volume through NEAR Intents has exceeded $32 billion, which is about 45% higher than the cumulative data reported in the previous quarter.
The protocol also indicates that more than 8 million US dollars have been used for token repurchases.
At the same time, the total value locked in its privacy-oriented Confidential Intents is approximately $160 million, representing a growth of about 463%.
These data indicate that the use of NEAR infrastructure is expanding. However, network growth and token buybacks do not guarantee that the market price of NEAR will immediately rebound.
Resistance around $5.02 suppresses rebound attempts
On the four-hour chart, NEAR is still below the 50-period exponential moving average of $5.0179, as well as the descending resistance trend line near $5.0261.
These two factors together constitute the first major obstacle for buyers attempting to regain short-term momentum.
If it can continuously break through $5.0261, that will strengthen the reasons for a rebound and bring the high of $5.5780 on September 28 into sight. Further above, the integer level of $6.00 will become the next upward reference point.
Before NEAR breaks through this resistance range, rebounds are still likely to encounter selling pressure. The Relative Strength Index (RSI) on the daily chart is close to 50, indicating moderate momentum, which is below the neutral midpoint.
The Moving Average Convergence Divergence (MACD) indicator has also slightly fallen below the signal line, indicating that the upward momentum is weakening.
These readings support a cautiously optimistic outlook in the short term, but they do not indicate that a broader upward trend has reversed.
NEAR is currently still operating above the 200-day moving average of around $4.5513, which indicates that an important technical support level is still intact.
If the callback continues, the 200-day exponential moving average near $4.55 will provide the first important support reference.
Below that, the horizontal support level of $4.4440 marks the area that limited the decline on October 8th. Holding this range will help to interpret this drop as a pullback within a larger upward trend.
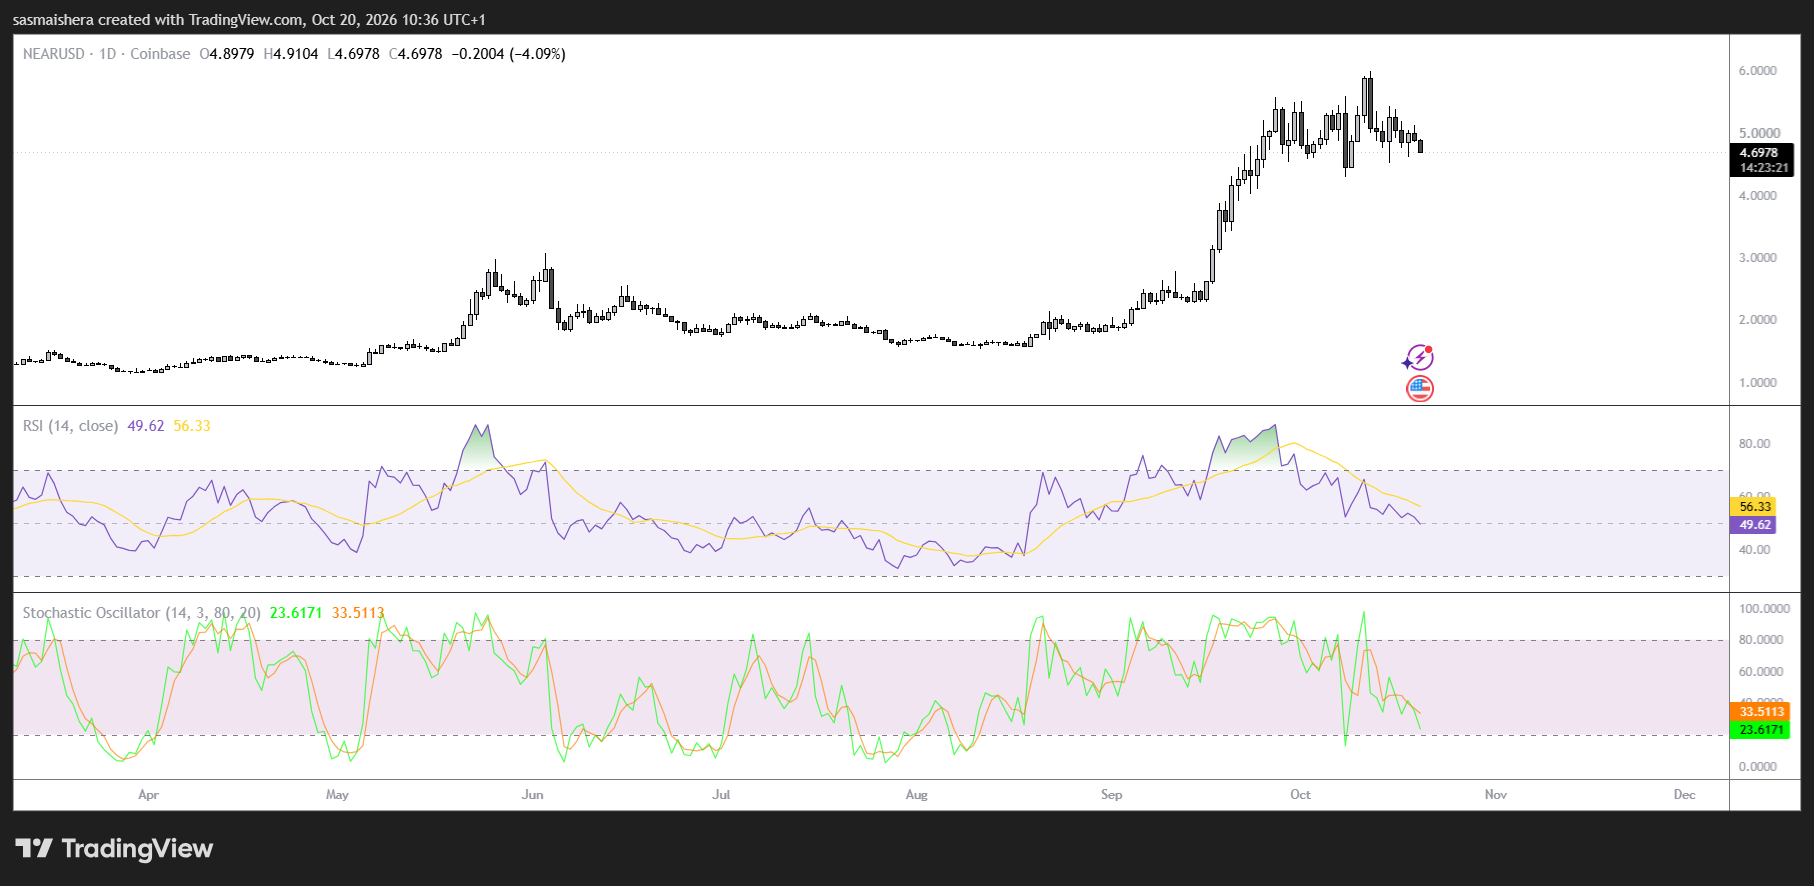
If it continues to fall below these two levels, this structure will be weakened, increasing the risk of further decline to $3.9140; that level is the high from September 19th.
Currently, the outlook for NEAR depends on whether buyers can hold the support level and regain the resistance range of around $5.02, although the net inflows and online activity for ETF remain positive.