

Bitcoin rebounds with U.S. stocks, but still fails to break through the $84,200 resistance level
During the rebound in the U.S. stock market on Tuesday, Bitcoin briefly rose back above $83,000 before falling back to around $82,600; at the same time, oil prices declined, and risk assets generally moved higher.
- Bitcoin once broke through $83,000, before falling back to around $82,600.
- U.S. stock market rose driven by falling oil prices, with healthcare stocks hitting record highs.
- Trader Ardi considers $84,200 as a threshold for Bitcoin to break through the local bearish structure.
- According to Glassnode, the selling pressure has eased to some extent, but before the rebound on Tuesday, the demand for spot and ETF remains weak.
CoinGecko The latest data shows that Bitcoin is trading at $82,601.56, up 0.8% in 24 hours, with a intraday range of $81,155.23 to $83,249.46. This data indicates that despite recovering from previous declines, the cryptocurrency is still below its daily high.
Ethereum has also joined the upward trend. According to this data provider, ETH is trading at $2,437.55, up 1.6% for the day. Its 24-hour range is from $2,374.52 to $2,471.63, which means that this second-largest cryptocurrency by market value is still below its own intraday high.
U.S. stocks rise, oil prices fall back
During trading on Tuesday morning, the S&P 500 index rose by 0.70% to 7,744.72 points; the Nasdaq Composite Index rose by 0.59% to 26,585.47 points. As oil prices fell, healthcare stocks reached record highs, helping the stock market to rebound after a week of dominance by tech stocks.
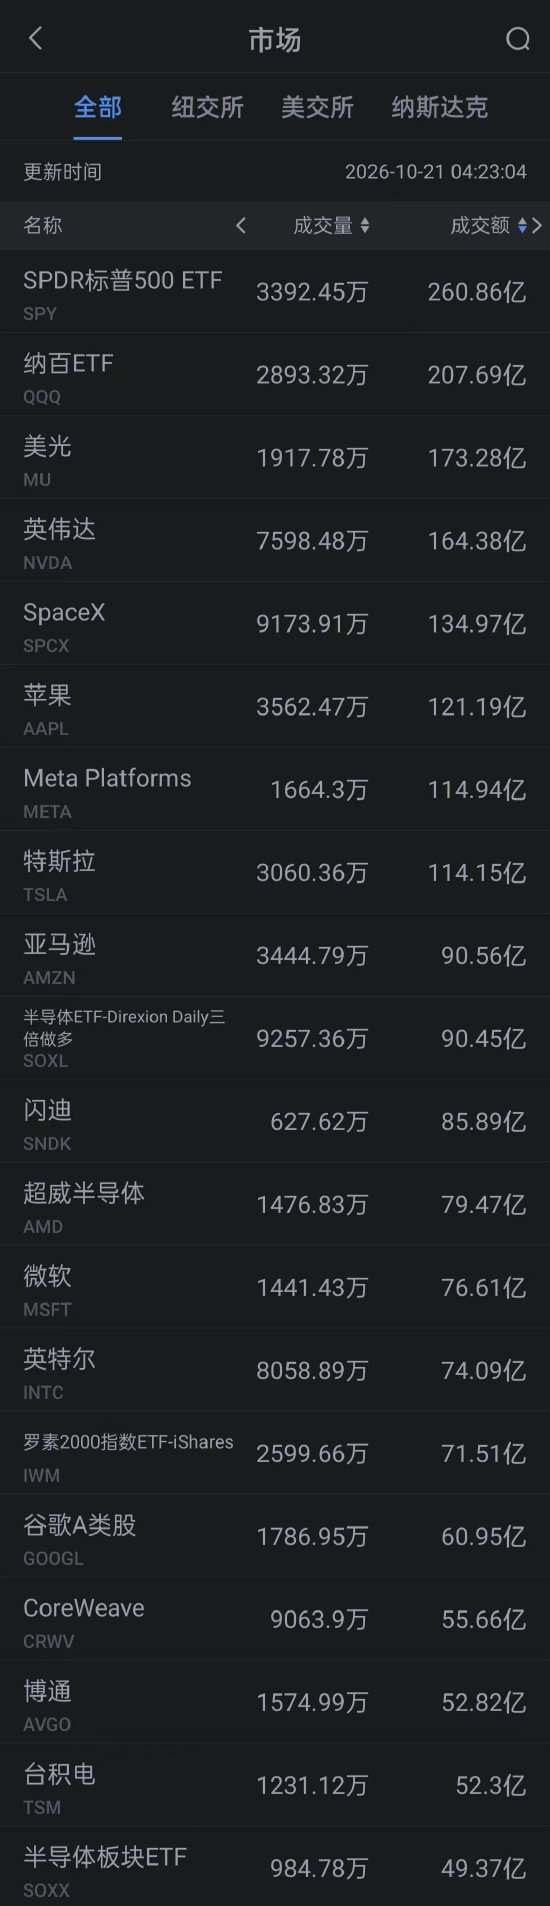
This round of stock market gains continued the rebound from Monday. At that time, investors bought technology stocks, as concerns regarding the debt of CoreWeave and the financing costs of artificial intelligence infrastructure had previously weighed on that sector, according to Reuters.
As reported on MarketWatch on Tuesday, Bitcoin rose by 1.3%, after having fallen as much as 0.9% at one point during the session. Another stock market update stated that more than 400 of the components of the S&P 500 index rose, and the decline in oil prices occurred alongside the market's hopes for peace negotiations.
Analyst Naeem Aslam stated in Monday's assessment that the rebound in Bitcoin was attributed to improved liquidity expectations, as well as a decline in market expectations for the Federal Reserve to raise interest rates in the short term. Barron quoted his view, saying that this rebound is not yet sufficient to confirm that the trend has reversed permanently.
Aslam warns that persistently high inflation, tight lending conditions, and uncertainties in monetary policy are still affecting the demand for risk-sensitive assets.
Bitcoin remains below the $84,200 threshold set by analysts
Before the rise on Tuesday, crypto.news reported that trader Ardi pointed out in an assessment of Bitcoin's resistance rebound on October 16 that $84,200 was the level that Bitcoin needed to break through. Only by standing above this position could it break its local bearish structure.
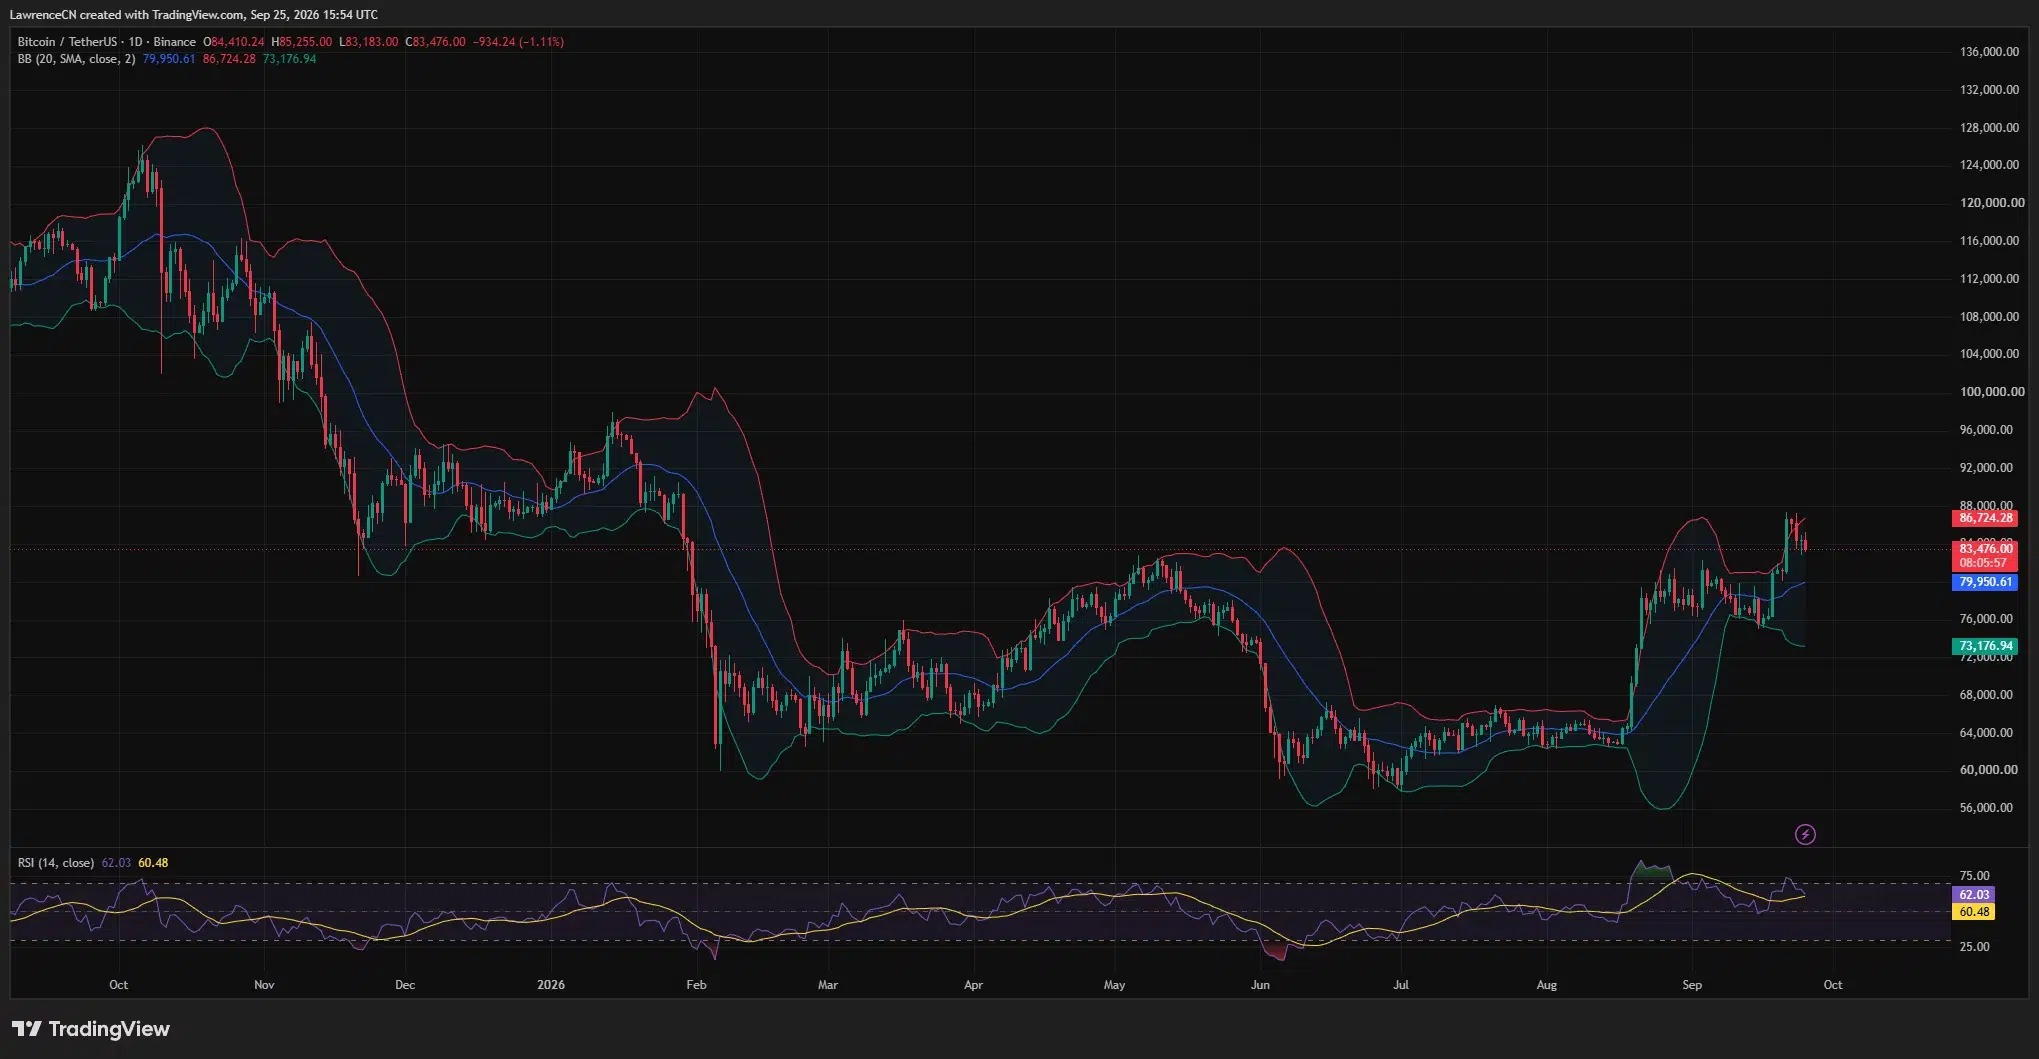
This trader's judgment is based on the trend of Bitcoin after it rebounded from a weekly low of nearly $79,800. At that time, Bitcoin was close to its 50-day moving average, which was indicated on the daily chart to be at $81,279.
Ardi indicates that once a certain threshold is breached, he will consider establishing a long position along the trading range. The condition is that the price needs to break through a series of recent lower highs.
Calculated based on the intraday high of $83,249.46 given by CoinGecko, the threshold of $84,200.00 set by Ardi is $950.54 higher, representing a difference of 1.14%. If we use the subsequent quote of $82,601.56, reaching that threshold would require a rise of 1.94%. This calculation merely compares the levels previously suggested by analysts with current price observations and does not imply that those levels are necessarily valid, nor does it mean that Bitcoin will definitely reach that position.
The analysis on October 16 also cited a one-week liquidation heat map for CoinGlass, which indicated concentrated areas around $83,300 to $83,700 and $84,300 to $84,700. These are merely historical estimates of potential forced liquidations and do not represent liquidations that actually occurred during the rebound on Tuesday.
Earlier this month, on October 9th, a Bitcoin technical analysis recorded a daily chart price of Binance at $83,012, with a weekly low of $80,394. The daily Supertrend line was at $79,663.52, while the weekly chart was still above the upper track of the descending wedge pattern.
The same analysis also recorded a bearish crossover on the daily chart for MACD; the MACD line was at 1,172, which is below the signal line of 1,709.23. Both readings were still above the zero axis in the chart snapshot at that time.
Glassnode states that the selling pressure before the rebound has weakened
Glassnode stated in the Market Pulse of October 19th that the selling pressure behind the decline at the beginning of October had weakened, but demand did not recover accordingly.
The strong selling pressure that fueled this round of decline has weakened, but new demand has not yet filled the gap.
The institution found that, covering the week up to October 18th, perpetual contract traders were still net sellers, although the selling pressure had eased somewhat. The outflow of funds for ETF narrowed to about $230 million, while the trading volume for ETF fell below the lower reference range set in the report.
Spot trading still shows continuous aggressive selling pressure. Glassnode records the cumulative spot trading volume difference ( cumulative volume delta ) as negative $83.6 million, compared to negative $67 million in the previous week.
The institution stated that option traders continued to pay for downside protection, with the 25 Delta skew rising, and the implied volatility being higher than the actual volatility. Both on-chain transaction fees and the volume of transfers decreased by about 10%, while the number of active addresses remained relatively stable.
The outlook for October depends on demand and support levels.
In the comments on Bitcoin's support level in October on October 1st, ViaBTC Chief Analyst Jeff Ko and Bitget Wallet Research Leader Lacie Zhang both regarded $82,000 as an important downward level.
Zhang has set the main downward consolidation range between $82,000 and $82,500, warning that once this range is broken, the decline towards $80,000 could accelerate. Her prediction is based on the assumption that institutional buyers will be able to absorb the sell-offs from long-term holders and miners.
The research leader estimated the range for October to be between $78,000 and $95,000; to achieve a bullish scenario, Bitcoin needs to once again surpass $87,500. She stated that if the price continues to fall below $80,000, this seasonal expectation will no longer hold true.
Ko mentioned that after the release of the Personal Consumption Expenditure Price Index ( PCE ), Bitcoin saw a rebound of over 2%, briefly breaking above $85,500, but the gains were later reversed. Zhang listed high oil prices, high interest rates, and renewed inflationary pressures as obstacles in its October forecast.