

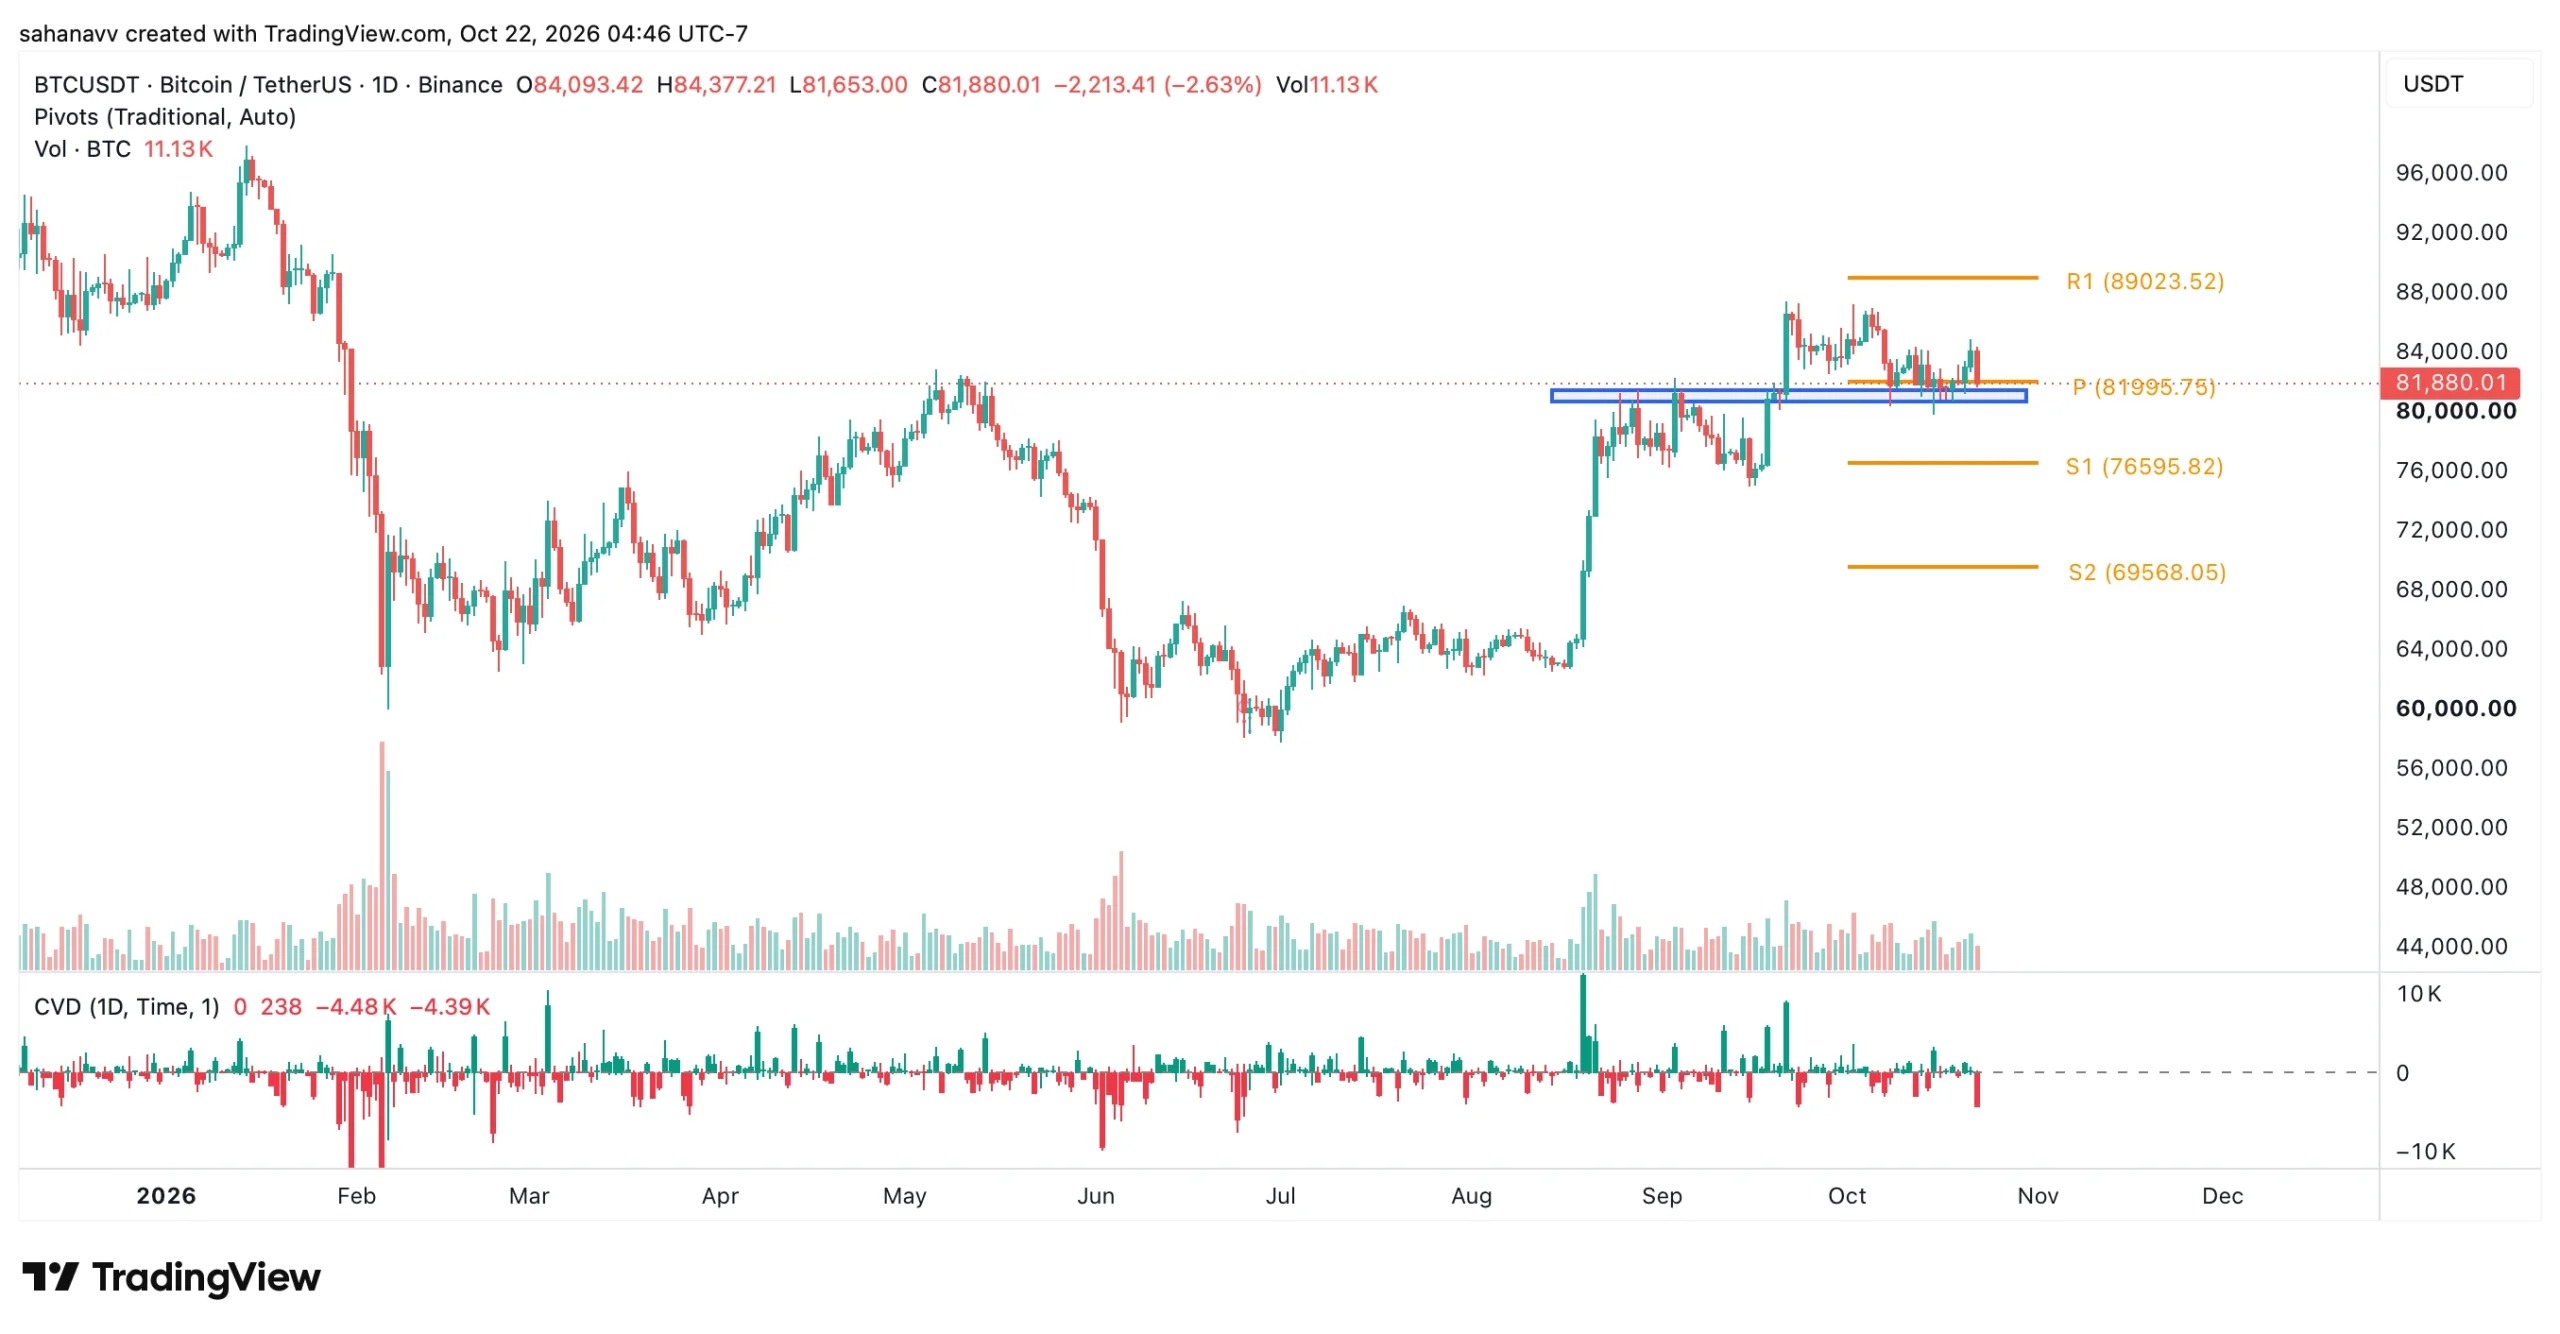
The $81,500 support level for Bitcoin is of critical importance; if it is breached, there could be a decline to $76,596. However, regaining the $89,000 level would strengthen the bullish momentum.
The capital flow of Bitcoin ETF is unstable, making this round of recovery market still fragile; to make the $100,000 target a reality, there needs to be a continuous inflow of funds and a confirmation of breaking through the resistance level.
In the past few weeks, the price of Bitcoin has continued to rise with volatility. Just before the end of the third quarter of 2026, this cryptocurrency broke through a key support level around $81,000 and has since remained above that range. However, after maintaining this level for nearly four weeks, Bitcoin is now under pressure again, with selling pressure intensifying. The price of Bitcoin once climbed to around $86,000 to $87,000, but then turned downward, with the latest candlestick closing at $81,880, representing a decline of nearly 2.63%.
This raises a key question: is this just a temporary rebound within a larger-scale repair, or is it the beginning of a deeper decline?
Bitcoin approaches the key support level of $81,500
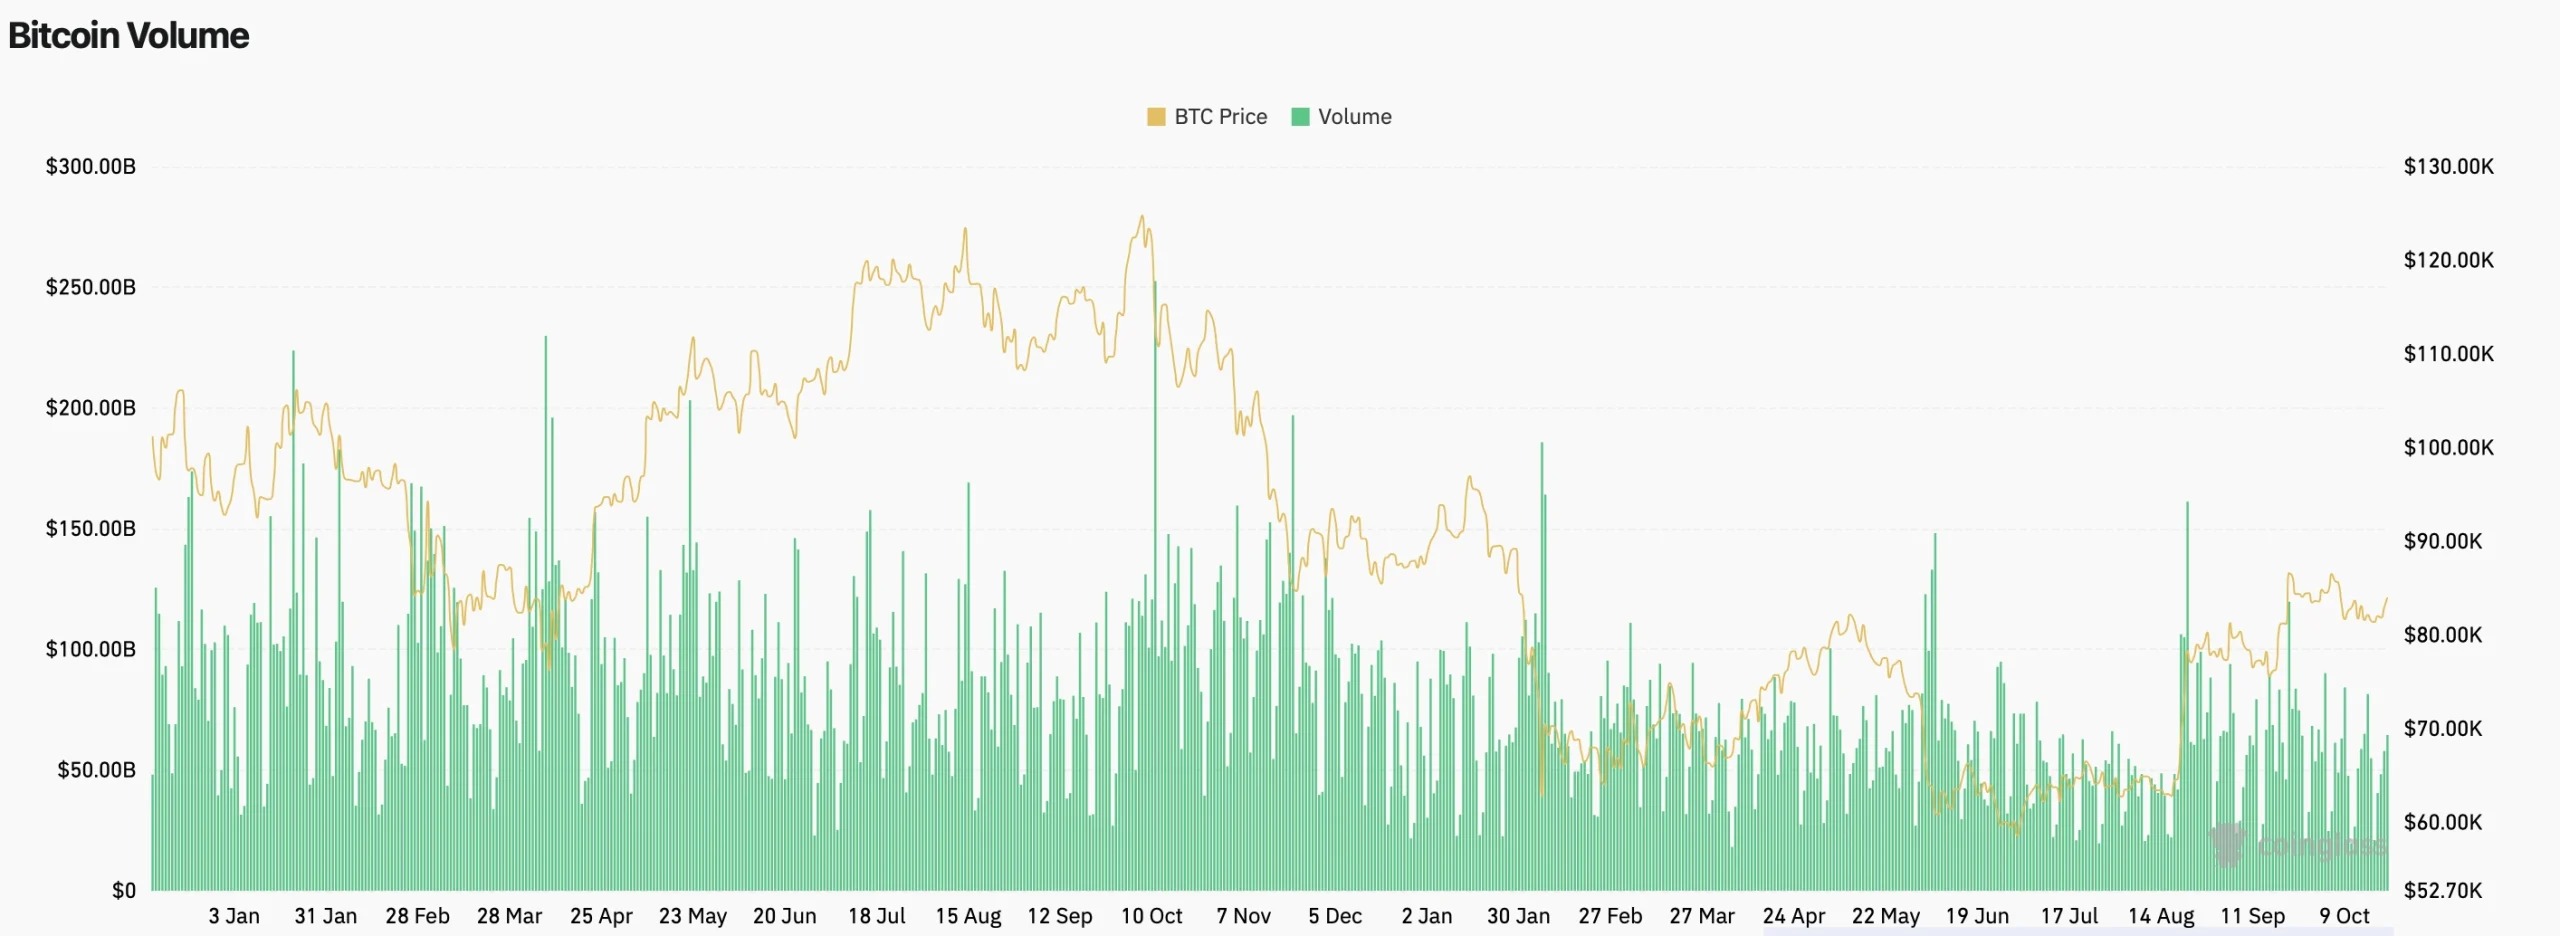
After failing to break through $85,000, Bitcoin's momentum has weakened, and it is now falling back towards its support range. After a decline of 2.63%, the price has fallen below $82,000, approaching the key level of $81,500. Trading volume also provides additional context; charts show that trading volume has significantly surged during major price fluctuations, including sharp drops and rebounds.
These surges indicate an increase in market activity. If the price of BTC continues to fall while trading volume rises, it may signify stronger selling pressure. On the contrary, if the price stabilizes and trading volume decreases, it may indicate that the selling momentum is weakening. In addition, technical indicators provide another clue for a rebound in the price of BTC.
The cumulative trading volume difference ( CVD ) has turned into a severely negative value, indicating that the aggressive selling pressure has surpassed the buying pressure. If this pattern continues and prices are difficult to recover, the risk of further decline may increase. Currently, prices are trading below the $82,000 pivot point, putting the token at a critical juncture. If this support range is lost, prices could fall further to $76,600; however, if there is a rebound, the bullish outlook can still be maintained.
ETF Capital flow indicates that institutional demand may rise
The ETF capital flow chart shows a mixed pattern of inflows and outflows, rather than a continuous stream of funds entering the market. Strong inflow days can provide additional buying support, while large-scale outflows may indicate weakening demand and increase pressure during periods of declining prices.
The key information from the chart is that the capital flow of ETF has not provided a sustained and reliable support level for Bitcoin. Although there were strong inflows during that period, BTC recently fell from around $86,000 to $87,000 to close at $81,880. This divergence indicates that demand alone from ETF is not sufficient to prevent the latest round of declines. To achieve a more convincing recovery, Bitcoin still needs sustained capital inflows from ETF as well as a more stable price trend.
Bitcoin Price Forecast: Bullish Recovery or Further Correction Ahead?
The next move of Bitcoin depends on whether buyers can hold the support range between $81,000 and $82,000 and regain the central pivot near $82,000. If prices rise above that level and continue to break through $89,000, it will strengthen the bullish scenario and bring $100,000 back into sight.
If the price of BTC falls and finds support around $81,500, a bearish scenario is more likely to occur, which could put this rebound at risk of reaching $76,600 or even lower levels. For now, the outlook for Bitcoin remains cautiously optimistic, rather than clearly bullish.