

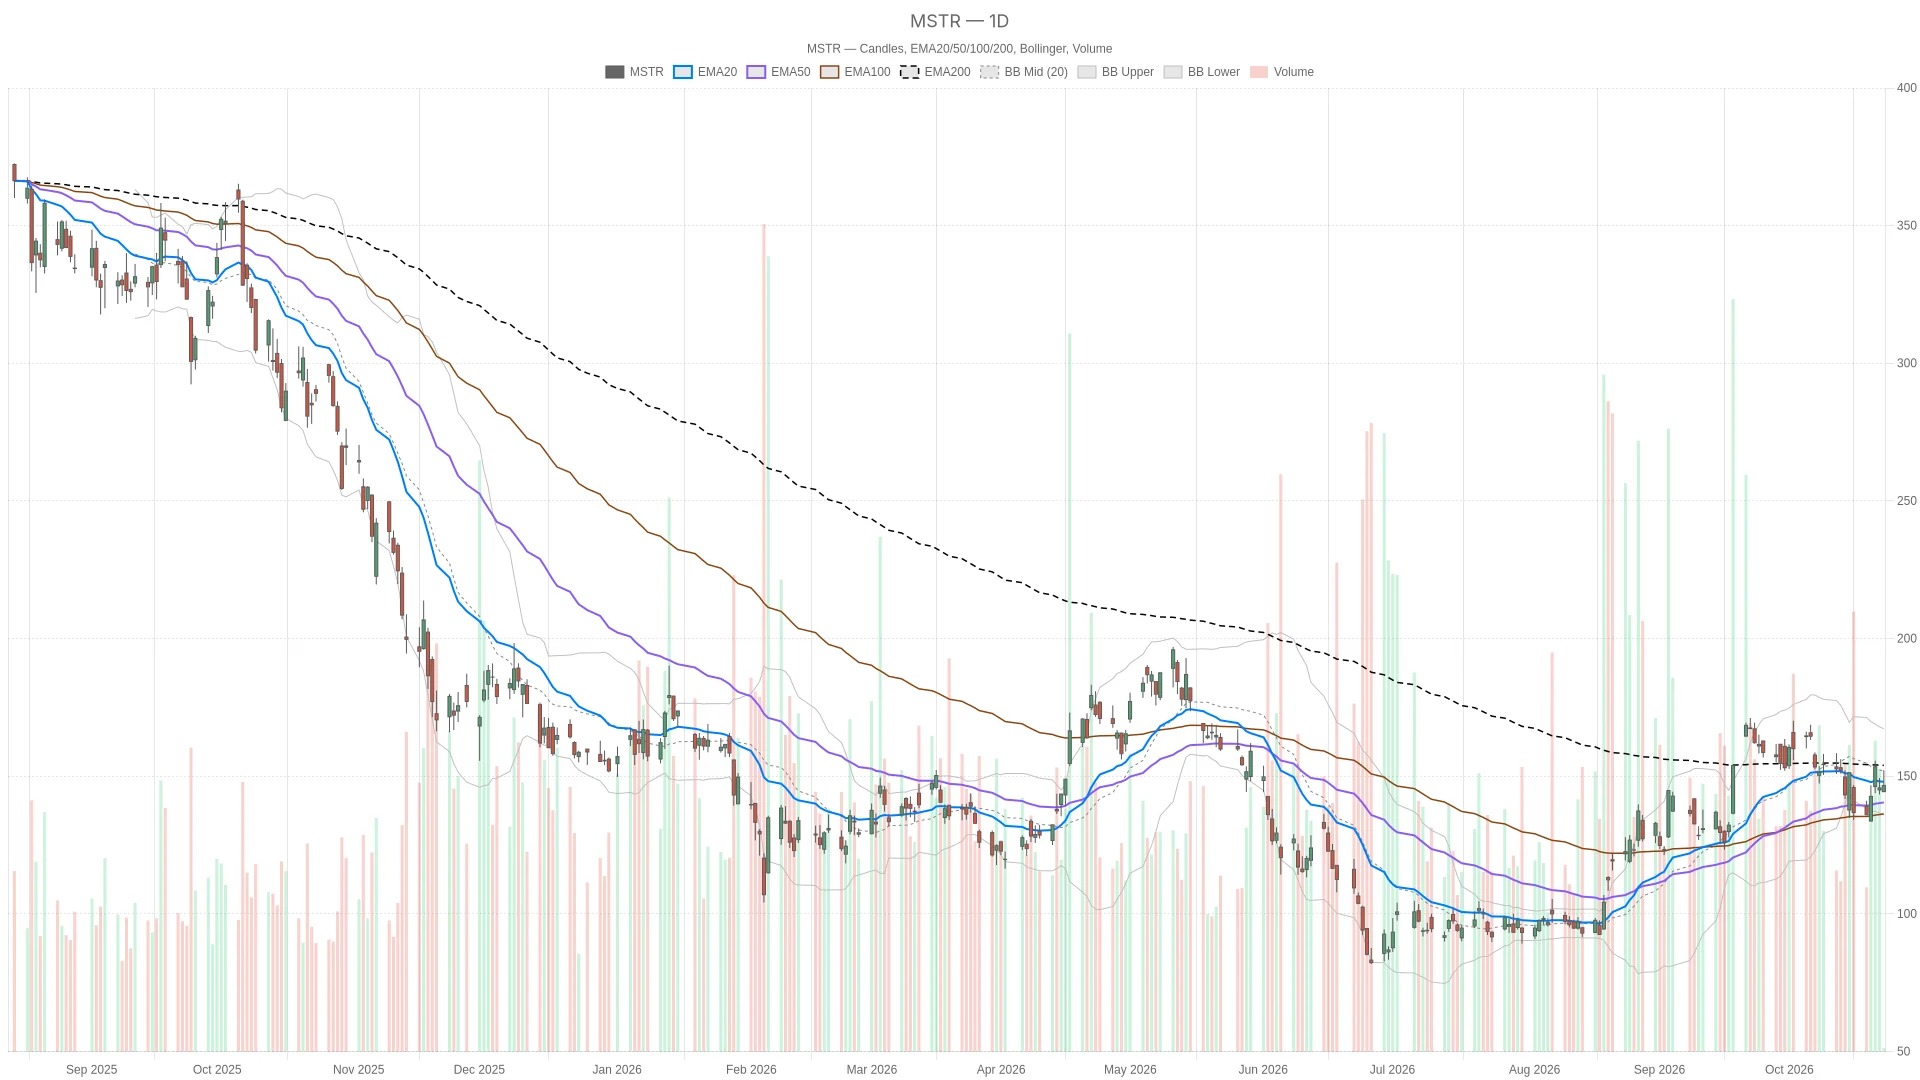
MSTR The stock price today presents a neutral daily chart structure, with a cautious outlook in the short term. Strategy It is still below the 20-day moving average of $148.01, while the 50-day moving average of $140.52 provides support, making the overall trend rather mixed. The hourly chart also hardly gives any confirmation of a bullish trend.
As of Friday, October 23, 2026, Strategy opened at $144.43 and fluctuated between $144.21 and $152.20 during the trading session. At 3:39 p.m. Eastern Time, the stock was trading at $146.675, up 0.6% from the previous day's closing price. Trading for the day was still in progress. Strategy opened at $144.43, with a low of $144.21 and a high of $152.20 during the session, and the latest price was $146.68, compared to a previous closing price of $145.80.
Key Points
- As of 3:39 PM Eastern Time, the stock price of MSTR was reported at $146.675, representing a 0.6% increase from the close on Thursday.
- The daily line RSI14 is at 49.95, which is below the neutral threshold of 50.
- The price is below the 20-day EMA of $148.01, but above the 50-day EMA of $140.52.
- The value for hour RSI14 is 49.02, while the value for hour MACD in the bar chart is -0.25, which is a negative value.
MSTR Stock Price Today: Daily chart signals still do not indicate a clear direction
The daily chart does not provide clear directional signals. The price is trapped between the 20-day EMA of $148.01 and the 50-day EMA of $140.52.
The price is below the 20-day EMA of $148.01 and the 200-day EMA of $152.42, but still above the 50-day EMA of $140.52. This position indicates that there is resistance above, but a complete bearish structure has not yet formed.
Meanwhile, the daily line RSI14 is at 49.95, slightly below the neutral threshold of 50. The MACD line is at 0.66, below the signal line of 2.49, and the bar chart shows -1.83. The aforementioned readings do not provide clear confirmation of bullish momentum.
Be cautious on the hourly chart; use the 15-minute level to identify key moments.

The hourly chart further reinforces a cautious stance. The price is below key short-term moving averages, and momentum indicators also do not provide any bullish confirmation.
The price is below $147.3 for the 20-hour EMA and $147.05 for the 50-hour EMA, but above $146.52 for the 200-hour EMA. The value for the RSI14 hour is 49.02, which is lower than 50. The MACD line is 0.48, below the signal line of 0.74, and the bar chart shows -0.25.
In addition, the price is below the hourly pivot point of $147.1 and the middle band of the Bollinger Bands at $149.08. The first support level at the hourly time frame, which is $145.83, is below the current price, while the first resistance level at $147.91 is above it. The hourly ATR14 has decreased from 3.11 to 2.91, indicating that the measured range of fluctuation is smaller compared to the previous candlestick.
15 minutes is a useful time frame for making short-term timing decisions.
From a short-term perspective, the price is slightly above the 15-minute pivot point of $146.64, and it is located between the first support level of $146.29 and the first resistance level of $146.98.
However, the price is still below the 15-minute 200-period EMA at $147.77, the 50-period EMA at $147.94, and the 20-period EMA at $148.16. The RSI14 is at 43.17, which is below 50, and the MACD line is -0.1, which is 0.34 below the signal line. Therefore, this time frame does not confirm a bullish pattern.
News Background and Contextual Situation
Recent news provides context for the actions of the company Strategy.
According to another report by Yahoo Finance, on Wednesday it was stated that the board of directors of Strategy would increase its securities repurchase capacity to $3 billion. Another report released on Thursday mentioned that Strategy is expected to announce its financial results next week. This information provides some context.
The bullish scenario depends on a breakout above $148.01.
A bullish scenario requires the price to first break through the 20-hour EMA level of $147.3, and then surpass the 20-day EMA level of $148.01 on the daily chart. If it can hold above these levels, it will increase the likelihood of the price being accepted above the first resistance level of $149 on the daily chart. Further upwards, the middle band of the daily Bollinger Bands at $151.72 and the 200-day EMA level of $152.42 will constitute additional resistance.
Looking at the breakdown, the target points to support at $140.52.
On the contrary, if it falls below the daily pivot point of $146.2, the bullish arguments will be weakened. If it then falls below the first daily support level of $143.01, the near-term bullish outlook will become invalid. At that time, the 50-day EMA of $140.52 will become a key focus. The lower band of the daily Bollinger Bands at $136.18 will serve as a further reference for downward movement.
Overall, the stock price of MSTR is currently still above the daily pivot point, but below the key daily and hourly moving averages. The daily ATR14 level is 9.79, indicating that volatility remains a core factor in the assessment. Only when the price breaks through the nearby resistance or falls below the identified support will the direction become clear.
Frequently Asked Questions
MSTR Where is the stock price traded today?
As of Friday, October 23, 2026, at 3:39 PM Eastern Time in the United States, MSTR was trading at $146.675, up 0.6% from the previous trading day's close. Trading for the day is still ongoing.
What key levels of the MSTR stock price need to be watched today?
On the daily chart, $148.01 on the 20-day EMA level is a nearby resistance level. The daily pivot point of $146.2 and the first support level of $143.01 are key references for downward movement. On the 50-day EMA chart, $140.52 serves as a deeper support level.
MSTR What is the daily line price of RSI?
The daily line RSI14 is at 49.95, slightly below the neutral threshold of 50, reflecting that there is no clear momentum in either direction.
Cryptonomist and the author do not hold any positions in the financial instruments mentioned in this text, nor have they received any compensation from the companies reported.
This article was generated with the assistance of artificial intelligence and has been reviewed by an editorial team.