

There are more daily charts for Azitra, but shorter time frames make the chart patterns more complex. The stock price is above the daily moving average and the upper band of the Bollinger Bands, but RSI is already in an overbought zone. The hourly chart supports this directional judgment to a greater extent; however, the 15-minute chart provides less favorable timing signals.

Key Points
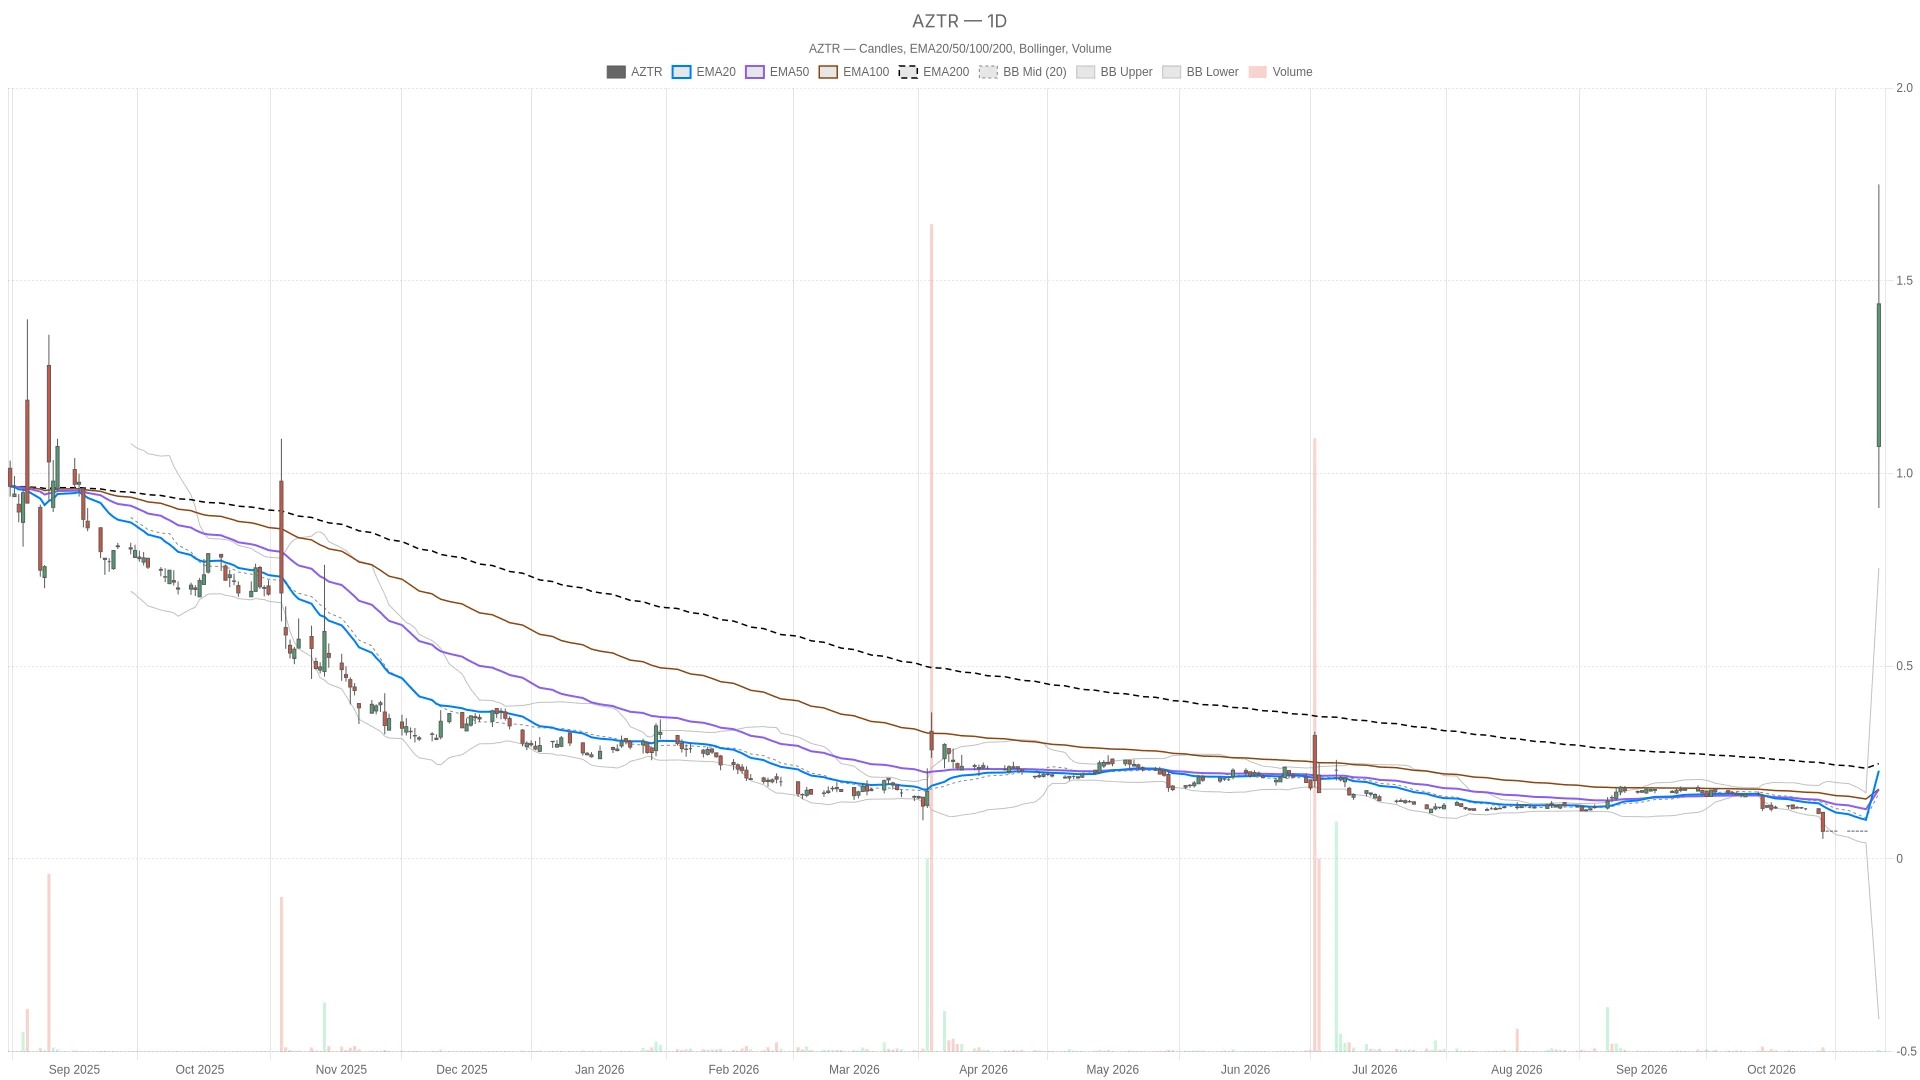
- The daily line RSI14 is at 96.39, clearly in an overbought range; the daily line MACD is at 0.09, which is higher than the signal line of 0, and the bar chart shows a positive value of 0.09.
- The stock price is above the upper Bollinger Band of $0.76 and the middle band of $0.17 on the daily chart.
- The stock price is higher than the 20-day EMA of $0.23, the 50-day EMA of $0.18, and the 200-day EMA of $0.81; however, the 200-day moving average is still above the two shorter moving averages.
- The daily ATR14 price rose from $0.01 to $0.13; the hourly RSI14 price fell from 96.45 to 94.23, and the 15-minute RSI14 price dropped from 79.11 to 73.31.
- As of Monday, October 26, 2026, AZTR opened at $1.07, fluctuated between $0.91 and $1.75 during the session, and was last reported at $1.44, with a previous closing price of $0.07. At 12:05 Beijing time on ET, the stock was priced at $1.44, representing a 1900% increase from the previous closing price, with a trading volume of approximately 983,788 shares.
The daily chart of Azitra supports the judgment of bias.
The daily price is above the 20-day EMA of $0.23, the 50-day EMA of $0.18, and the 200-day EMA of $0.81. However, these moving averages do not form a complete bullish arrangement: the 200-day moving average is still higher than the other two shorter moving averages. The price position supports a bullish perspective, but the structure of the moving averages does not provide as strong confirmation.
At the same time, the daily line RSI14 is at 96.39, which is clearly in an overbought zone. The daily line MACD is at 0.09, which is higher than the signal line of 0, and the bar chart shows a positive value of 0.09. These readings support positive momentum, but they also indicate an overbought condition, making the timing of entry more complex.
In addition, the price is above the upper band of 0.76 USD and the middle band of 0.17 USD on the daily Bollinger Bands chart. This indicates that the price is currently operating outside of the upper band, rather than within it. The daily ATR14 has risen from 0.01 USD to 0.13 USD, showing higher volatility compared to the previous completed daily candlestick.
Hourly chart indicates a bias towards the upside, but short-term timing signals are mixed.
On the hourly chart, the price is above the 20-hour EMA of $0.46, as well as above the 50-hour EMA of $0.27 and the 200-hour EMA of $0.18. The moving averages are arranged in a descending order below the price, forming a complete bullish alignment. The price is also above the upper band of the hourly Bollinger Bands at $1.26, further reinforcing its position outside of the upper band.
However, the hourly RSI14 indicator dropped from 96.45 to 94.23, but is still in an overbought range. The hourly MACD bar chart rose from 0.13 to 0.16, and the MACD line is at 0.24, which is higher than the signal line of 0.09. Therefore, the indicators are not consistent in their direction of change, although both are still indicating an overbought condition.
From an execution perspective, in the 15-minute time frame, RSI14 has dropped from 79.11 to 73.31, still remaining in an overbought zone. Its MACD bar chart has also decreased from 0.09 to 0.06, but it remains positive. The price is above the 20-day 15-minute EMA average of $1.01, but below the 15-minute pivot point of $1.58. This indicates that the moving average position is still on the bullish side, but the indicator changes are weak, and there is resistance above as well.
Key price levels to distinguish different scenarios
It is required that the price first break through the hourly pivot point of $1.49, and then stand above the 15-minute pivot point of $1.58. If it further breaks through the first resistance level of $1.62 at 15 minutes, this judgment will be strengthened. The next reference levels are the hourly first resistance level of $1.74 and the high of this trading session at $1.75. These pivot points are all derived from a completed candlestick in their respective time frames.
On the contrary, if it falls below the first hourly support level of $1.24, the bullish outlook for the short term will be weakened. Subsequently, the $1.01 level from the 20-period EMA in the next 15 minutes will become the next reference point, followed by the low of $0.91 from this trading session. If it continues to fall below that low, it will invalidate the bullish scenario within this trading session.
Overall, Azitra is above the daily moving average, but still below the hourly and 15-minute pivot points. The daily ATR shows higher volatility, with divergent readings of overbought conditions and short-term indicators. Whether the price will be able to break through these pivot points remains unclear before the end of the trading session.
Frequently Asked Questions
Azitra What is the current technical status on the daily chart?
The daily chart shows a bullish trend, with prices above all index moving averages as well as the upper band of the Bollinger Bands. The daily RSI14 indicator is at 96.39, clearly indicating an overbought condition. The daily MACD line is 0.09 higher than the signal line, and the bar chart shows a positive value of 0.09. However, the 200-day EMA is at $0.81, which is higher than the 20-day EMA at $0.23 and the 50-day EMA at $0.18; therefore, the moving averages do not form a complete bullish pattern.
Which key pivot points need attention?
The bullish scenario requires the price to first break through the hourly pivot point of $1.49, and then exceed the 15-minute pivot point of $1.58. If it can further surpass the first resistance level of $1.62 over a 15-minute period, this will strengthen the bullish outlook. The subsequent reference levels are the hourly first resistance level of $1.74 and the high of this trading session at $1.75. However, if the price falls below the hourly first support level of $1.24, it will weaken the current bullish assessment.
How does a shorter period compare to the daily outlook?
The hourly chart confirms a bullish trend, with prices above the three-hour EMA levels and showing a descending sequence. However, the timing signals on the 15-minute chart are weaker: the 15-minute RSI14 level has dropped from 79.11 to 73.31, and the MACD bar chart has decreased from 0.09 to 0.06, with prices still below the 15-minute pivot point of $1.58.
What does an overbought reading mean?
The daily line RSI14 is at 96.39, the hourly line RSI14 is at 94.23, and the 15-minute line RSI14 is at 73.31, all indicating an overbought condition. These readings coexist with a structure where prices are above both the daily and hourly moving averages, but this makes the timing of entry more complex, especially on shorter time frames.
Cryptonomist and the author do not hold any positions in the financial instruments mentioned in this text, nor have they received any compensation from the companies reported.
This article was generated with the assistance of artificial intelligence and has been reviewed by an editorial team.