


When the market regards medical and consumer necessities as a safe haven for AI trading, these “safe assets” have quietly evolved into new bubbles. The latest research from Bank of America shows that the bubble risk indicators for the defensive sectors of the U.S. stock market have surpassed those of tech stocks, NASDAQ, and even Bitcoin, a phenomenon that closely mirrors the market structure at the peak of the internet bubble in 1999.
The derivatives team at Bank of America pointed out in the latest edition of their "Global Equity Volatility Insights" report that as trading in AI has become unstable, a "hedge rotation" of funds into the healthcare and consumer staples sectors has pushed the bubble risk indicators ( BRI ) for these two sectors to record highs. As of October 23, the reading for the US healthcare sector BRI was around 0.8, which is the highest among all assets tracked by Bank of America, while consumer staples was around 0.74 and energy was around 0.7; in contrast, the tech sector was only around 0.5, NASDAQ was around 0.3, and the "Big Seven" was only around 0.25.
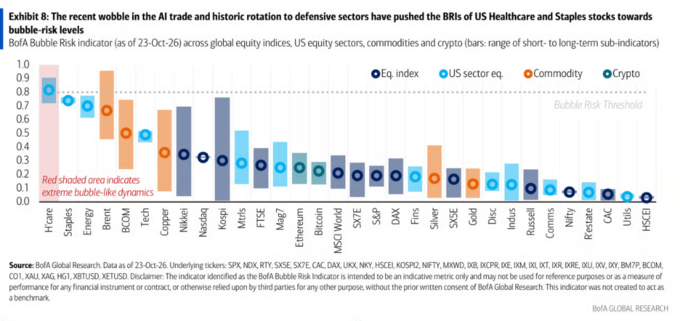
This pattern indicates that the degree of price inflation in 'defensive' assets, which are originally used to hedge against the risks associated with AI, has significantly surpassed that of the underlying assets they are supposed to protect. Meanwhile, Bank of America's Global Financial Stress Index rose from +0.09 last week to +0.20, reaching its highest level since April, suggesting that the overall market stress environment is deteriorating.
Defensive sectors BRI surpass tech stocks; historical precedents point to the peak of the internet bubble
BofA’s BRI is a purely price-based indicator that combines the return on assets, volatility, momentum, and “vulnerability” to generate a single bubble reading between 0 and 1. A reading above 0.8 is marked as indicating a higher risk of a bubble. This indicator was among the first to indicate that NASDAQ had crossed the “bubble threshold” in June of this year.
Bank of America added a new BRI heat map covering 30 years this week, tracking the historical readings of various sectors within the S&P 500. The data shows that during the internet boom at the end of the 1990s and during the COVID-19 market conditions after 2020, bubble readings rose almost simultaneously across all sectors, with defensive sectors being no exception.
Based on this, Bank of America concluded that in a market with structural bubbles, even if the fundamentals do not support it, various sectors may exhibit bubble-like dynamics. In other words, when the entire market enters a self-reinforcing cycle, even companies in industries such as toothpaste and pharmaceuticals may begin to trade like momentum stocks. Bank of America believes that signs of bubbles in the healthcare and consumer staples sectors further confirm its previous judgment that the market is moving towards a "more self-reinforcing mechanism that is prone to sharp rises and falls."
The bubble is still limited in scope and there is still a gap compared to the peak in 2000.
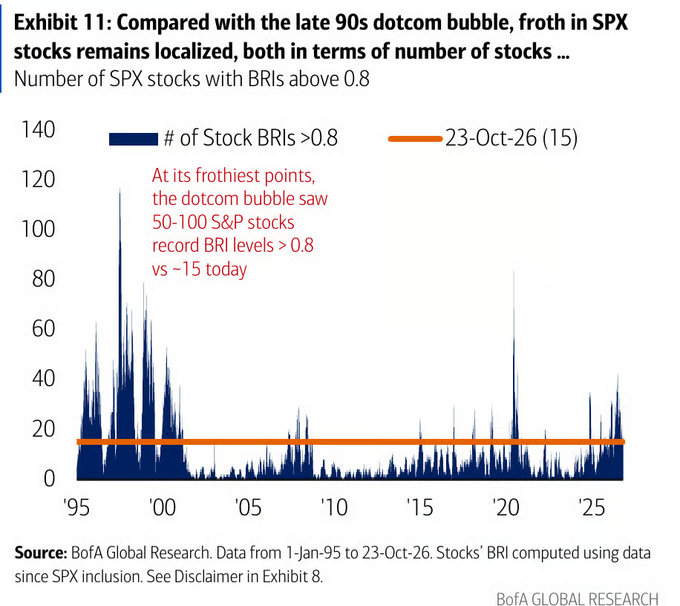
Despite the alarming signals, Bank of America also emphasizes that the current level of bubble expansion is far less than that of 2000. Currently, there are about 15 stocks in the S&P 500 with a BRI of over 0.8, whereas during the peak of the internet bubble, this number ranged from 50 to 100.
In terms of market capitalization weight, the gap is even more substantial: currently, these 15 stocks together account for only about 2.2% of the total market capitalization of the S&P 500, whereas during the peak of the internet bubble, this proportion was as high as 20% to 40%.
The composition of these 15 stocks is quite thought-provoking and is enough to confuse any intraday trader from 1999: Moderna, MRNA, Zebra, CrowdStrike, CRWD, IFF and Revvity ( RVTY ) are at the top, followed closely by Coca-Cola ( KO ), Amgen ( AMGN ), Cboe ( CBOE ) and Palo Alto ( PANW ). The fact that Coca-Cola appears on this list of bubble stocks is in itself the best commentary on the current market anomalies.
Bubbles spread to themes of high dividends and low volatility; the Financial Stress Index rises to a high level from April.
Bank of America has expanded BRI to include tracking of popular stock themes. Among these themes, the cloud computing sector has the highest bubble reading (although it has not yet reached extreme levels), followed by oil and gas, and high-dividend stocks. The stocks with the largest one-week increase were high-dividend stocks, followed by low-volatility stocks and biotechnology stocks – this indicates that the bubble is spreading to those asset classes that “allow you to wait patiently for returns.”
In Bank of America's custom baskets, the bubble hotspots are more dispersed: the Brazil elections basket BRI has a reading of 0.94, the U.S. cybersecurity basket is at 0.92, U.S. software is at 0.76, oil and gas (excluding renewable energy) is at 0.73, pharmaceutical super-large-scale computing power is at 0.70, and Japanese defensive stocks are also at 0.70. The baskets with readings close to zero are China Internet, Macau gambling, and China anti-involvement.
Meanwhile, Bank of America's Global Financial Stress Index has risen to +0.20, the highest level since April. Commodities and stocks are the asset classes that experience the most stress, with the implied volatility pressure on crude oil reaching its highest level since July 31. The European Stress Index has also surpassed its long-term median. Bank of America's GFSI risk allocator has shifted from neutral last week to a low allocation of 4.9%.
Bank of America recommends asymmetric protection rather than direct reduction of positions
In response to the aforementioned signals, Bank of America clearly stated that high readings of BRI are a "warning" signal, not a "exit" signal: Historical data shows that after readings exceed 0.8, the recent downside risk increases, but the upside potential is generally comparable. Therefore, the bank tends to increase asymmetric protection rather than selling directly.
Bank of America recommended a specific trading strategy last week, which is the "put option swap": by buying the November put options of XLP or XLV, and simultaneously selling put options of XLK for the same notional amount in November, one can obtain a small net premium (approximately 0.23% and 0.20% respectively, calculated based on the opening price on October 19th).
The logic behind this strategy is as follows: when everyone in the market hides their funds in the same batch of “safe” assets, those assets are no longer safe. The fervor during the Internet bubble era served as a reminder to investors that when liquidity floods the entire market, bubbles will eventually appear in every corner, including those sectors that were supposed to be immune. As financial pressures reach their highest levels in April, the focus of the market in the next phase may shift from “which bubble to hold” to “which bubble will burst first.”