

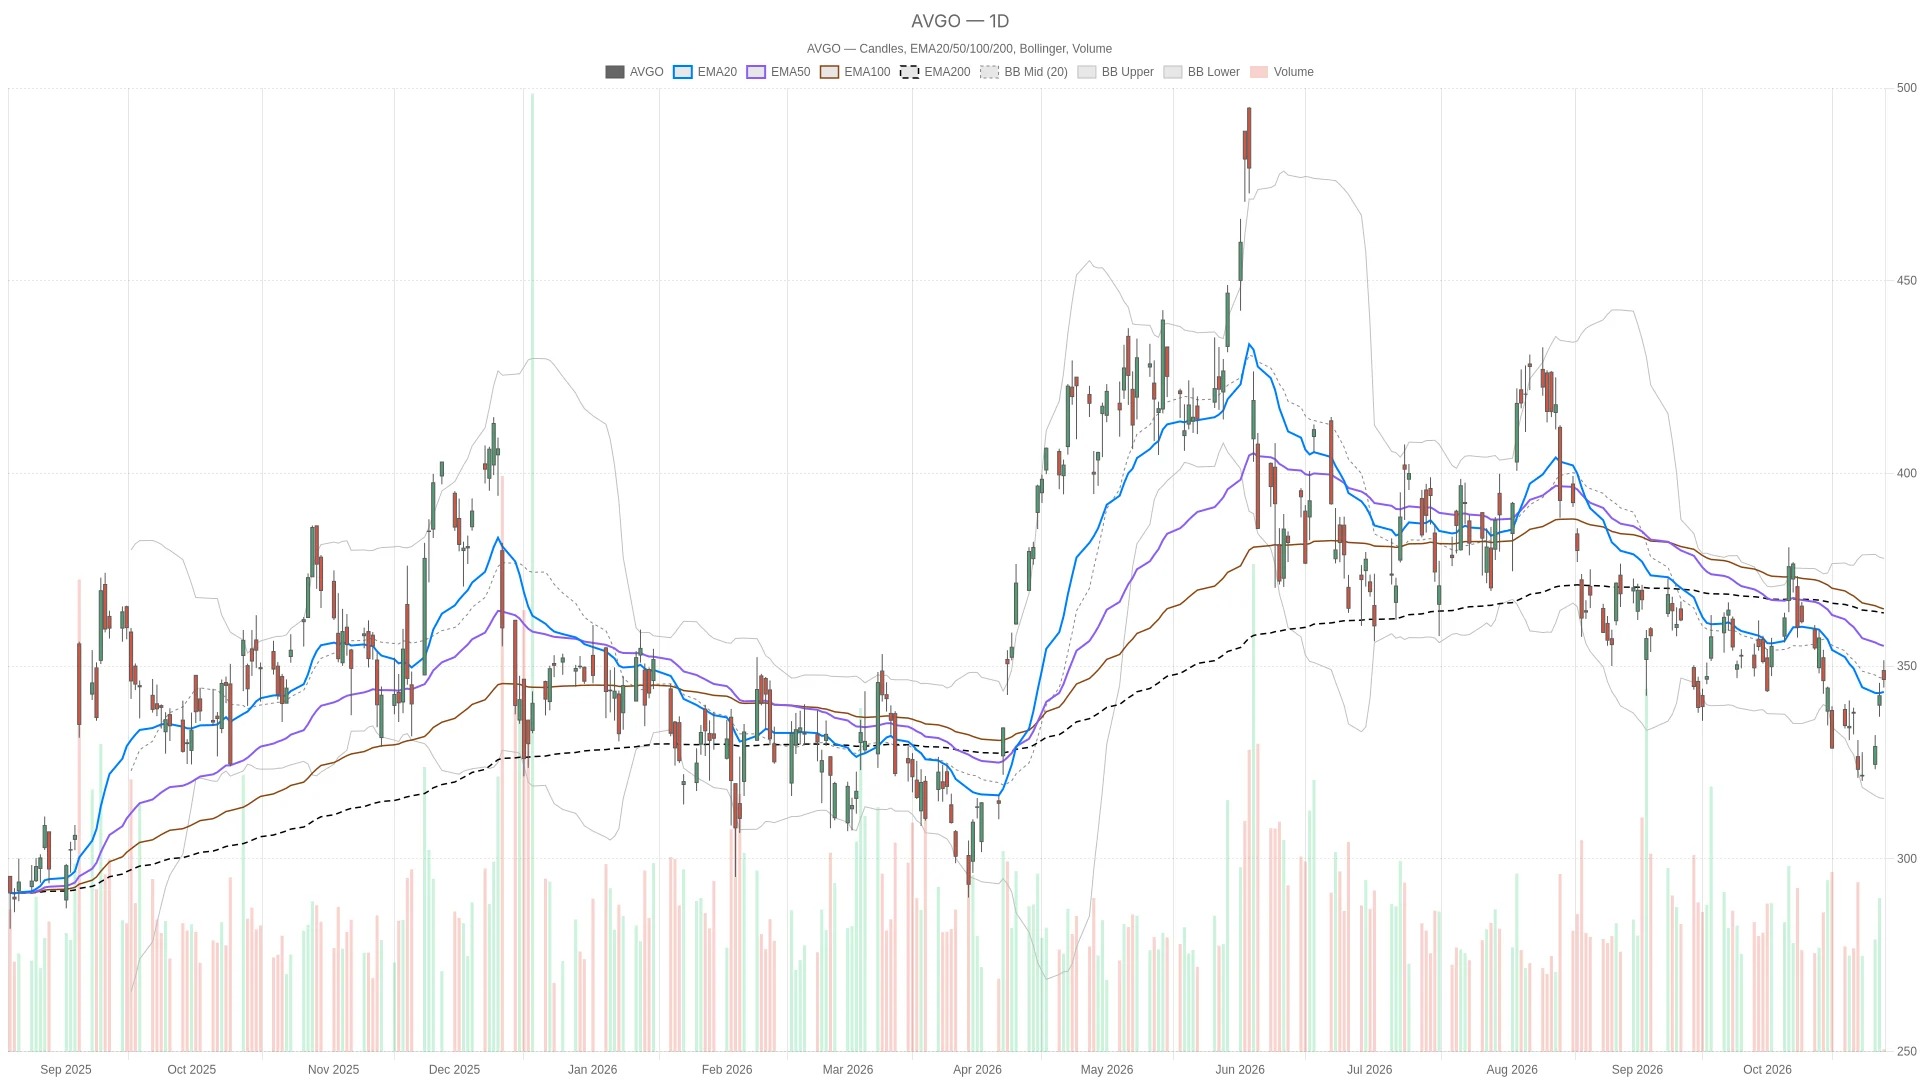
Analysis of Broadcom (Broadcom, AVGO) stock shows that its trading price is $346.53, an increase of 1.23%; the daily RSI14 indicator is at 50.02, which is in a neutral range, and a bullish crossover appears at MACD at 0.14.

Broadcom AVGO stock currently presents a neutral daily chart pattern, accompanied by a bullish crossover with MACD. However, longer-term resistance still limits the bullish outlook. The hourly chart provides some support, but the overbought condition of RSI and the contradictory signals on the 15-minute chart make short-term timing more complex. The stock opened at $348.85, hit a low of $344.46 during the session, a high of $351.53, and the latest price is $346.53, with the previous closing price being $342.33.
Key Points
- As of 12:12 Eastern Time on Wednesday, the stock price of Broadcom AVGO was reported at $346.53, representing a gain of 1.23% for the day.
- The daily line RSI14 is at 50.02, which is within the neutral range, higher than the previous value of 47.71.
- The daily MACD bar chart rose from -1.1 to 0.14, breaking through the zero axis; the MACD line is at -6.74, which is higher than the signal line of -6.88.
- The hour RSI14 is at 71.85, which is in the overbought range.
- The stock price remains above the 20-day EMA of $343.32 on the daily chart, but it is still lower than the middle band of the daily Bollinger Bands at $346.82 and the 50-day EMA of $355.25.
Broadcom AVGO: Daily line signals remain divergent
The daily chart structure of Broadcom AVGO stock is still unclear: the stock price is above the 20-period EMA of $343.32, but below the 50-period EMA of $355.25 and the 200-period EMA of $360.67. This arrangement indicates that there is short-term support below the price, but a bullish moving average pattern has not yet formed.
At the same time, the daily line RSI14 rose from 47.71 to 50.02, almost exactly at a neutral level. The daily line MACD bar chart increased from -1.1 to 0.14, breaking through the zero axis. The MACD line is at -6.74, which is higher than the signal line of -6.88, providing a bullish crossover signal for buyers; however, both lines are still within the negative range.
However, the stock price is still below the middle band of the daily Bollinger Bands at $346.82. The upper band is at $377.97, and the lower band is at $315.66, indicating that the price is closer to the center of the range rather than either boundary. The daily ATR14 is at $11.41, which can be used as a reference for assessing the level of nearby fluctuations.
The daily pivot point is at $341.62, and the first support level S1 is at $337.58, both of which are below the current price. The stock price is also only slightly above the first daily resistance level R1 at $346.38. These levels come from the previous complete daily candlestick chart and are applicable to the current trading session.
The strengthening of the hourly chart makes the neutral daily line analysis for AVGO more complex.
On the hourly chart, the stock price is above the 20-hour EMA of $338.17, the 50-hour EMA of $336.47, and the 200-hour EMA of $346.47. However, the 200-day moving average is still higher than the other two moving averages, so the moving averages have not yet formed a bullish pattern.
It is worth noting that the hour RSI14 is at 71.85, which is in an overbought zone. The hour MACD bar chart has dropped from 1.58 to 1.43, although the line MACD at 4.23 is still higher than the signal line at 2.8. The positive relationship of MACD supports the buyers, but the decline in the bar chart weakens this evidence.
The stock price is above the hourly pivot of $346.69 and below the first hourly resistance level of R1 at $346.93. The upper band of the hourly Bollinger Bands at $351.87 also serves as a reference level above. Therefore, the hourly chart supports the bullish side to some extent in the daily balance, but it does not resolve the resistance issue.
Short-term timing and financing background
At the same time, the execution signals indicated by the 15-minute chart are rather mixed. The stock price and its moving averages are in a bullish arrangement, above the 20-period EMA of $344.57, the 50-period EMA of $340.46, and the 200-period EMA of $336.84. The RSI14 is at 62.2, which is higher than the neutral level, but has not yet entered the overbought range.
In contrast, the 15-minute MACD line is at 1.79, which is lower than the signal line of 2, with a bar chart showing -0.21. The stock price is above the 15-minute pivot point of 346.06 USD, but slightly below the first resistance level of R1 at 346.54 USD. This immediate resistance level is important for short-term timing decisions, but it does not determine the direction of the daily chart.
Additionally, a report published on Tuesday, October 27th, stated that the CEO of Broadcom indicated that funds could still be obtained despite some lenders considering withdrawing from their financing for Anthropic chips. Another Yahoo Finance report mentioned that the scale of this financing was 63 billion US dollars. The reports stated that a carrier would purchase AI equipment for Anthropic, and Broadcom would provide support for the residual value of the collateral. These reports, released on Tuesday, provided the financial background for Broadcom.
Bullish and bearish conditions
For a bullish scenario, it is required that the stock price holds above the 20-day moving average of $343.32 ($BJWKEEP_00001__) and breaks through the middle band of the daily Bollinger Bands at $346.82. If it can also break through the hourly moving average of $346.93 ($BJWKEEP_00002__), this will add strength to the short-term confirmation signals. However, the 50-day moving average of $355.25 ($BJWKEEP_00003__) and the 200-day moving average of $360.67 ($BJWKEEP_00004__) still represent greater resistance levels to overcome.
On the contrary, if it falls below the 20-day moving average of $343.32, it will weaken the aforementioned bullish argument. If it then falls below the daily pivot point of $341.62, that would reinforce the bearish sentiment. The next reference level would be the daily support of $337.58.
Overall, the stock price of Broadcom AVGO is currently above the short-term support on the daily chart, but it is still below the longer-term moving average. The daily ATR14 is at $11.41. The issue that has not yet been resolved is whether the positive crossover of the daily MACD can coexist with a sustained breakthrough above the resistance level.
Frequently Asked Questions
What is the daily technical structure of Broadcom AVGO stock?
The daily chart shows a neutral trend. The stock price is above the 20-period EMA of $343.32, but below the 50-period EMA of $355.25 and the 200-period EMA of $360.67. The daily RSI14 indicator is at 50.02, indicating a neutral range, while the MACD indicator shows a bullish crossover, with the bar chart showing a value of 0.14.
What are the key resistance levels for AVGO?
The midline of the daily Bollinger Bands at $346.82 and the hourly R1 at $346.93 represent recent resistance levels. Further above are the daily 50-period EMA at $355.25 and the 200-period EMA at $360.67, which constitute even greater resistance challenges.
What does the hourly chart signal show?
The hourly RSI14 is at 71.85, which is in an overbought range. The hourly MACD remains positive, and the MACD line at 4.23 is higher than the signal line at 2.8; however, the bar chart has dropped from 1.58 to 1.43. The stock price is above the 20-hour and 50-hour EMA, but only slightly higher than the 200-hour EMA at $346.47.
Neither Cryptonomist nor the author holds any positions in the financial instruments mentioned in this text, nor have they received any compensation from the companies reported.
This article was generated with the assistance of artificial intelligence and has been reviewed by an editorial team.
Lorenzo Marcek
Lorenzo Marcek is a financial journalist and senior crypto market analyst, known for his clear and data-driven reporting on digital assets. With a background in economics and over a decade of experience covering global markets, he focuses on on-chain indicators, institutional adoption trends, and macroeconomic factors that drive crypto market fluctuations. His work combines investigative reporting with insights into the technology market, and he is regarded as a reliable source that provides traders with solid and actionable analysis.