

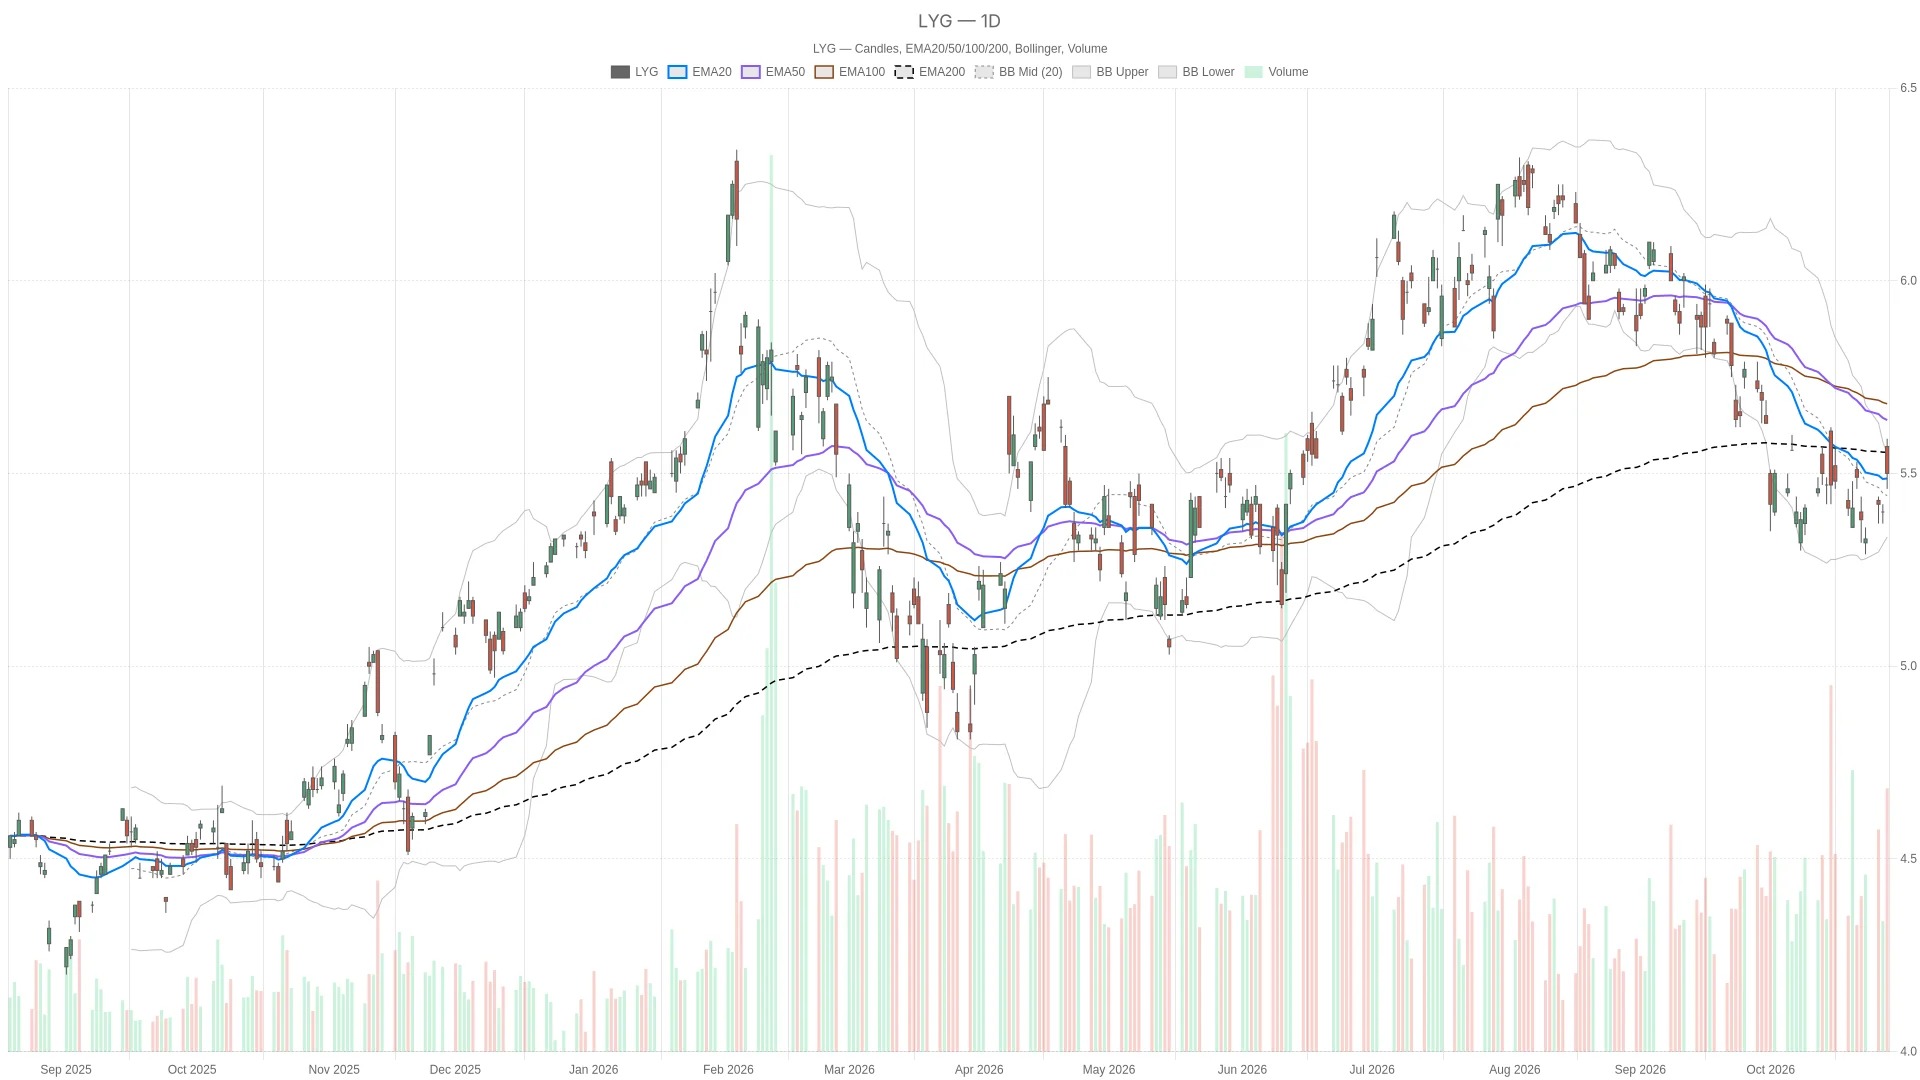
On Wednesday, October 28, 2026, LYG opened at $5.57 and closed at $5.50. During the session, it reached a low of $5.46 and a high of $5.59. The stock rose by 1.85% from the previous trading day's closing price of $5.40. Nevertheless, this positive trend did not eliminate the upper resistance visible on the daily chart.
Key Points
- LYG closed at $5.50 on Wednesday, October 28, 2026, up 1.85% from the previous closing price.
- The daily line RSI14 is at 48.09, which is below the neutral level of 50; the daily line MACD bar chart shows a value of 0.02.
- On the 20th, the 20-day EMA was at $5.49, slightly below the closing price; the 200-day EMA was at $5.51, and the 50-day EMA was at $5.64, all of which were above the closing price.
- The hourly line RSI14 is at 62.56, and the bar chart for MACD is at 0.01; the 200-hour EMA is at $5.56, still above the price level.
- The daily line ATR14 is at $0.12; the pivot point for the next trading day is at $5.52, with the first resistance level at $5.57 and the first support level at $5.44.
Daily Moving Average and Momentum Reading
The daily chart shows mixed signals. The price is above the 20-day EMA of $5.49, but still below the 200-day EMA of $5.51 and the 50-day EMA of $5.64. This arrangement puts LYG between nearby support and resistance levels, rather than within a completely bullish moving average structure.
Bollinger Bands, ATR and Pivot Points
The middle band of the daily Bollinger Bands is at $5.44, the upper band at $5.55, and the lower band at $5.34. The closing price is above the middle band but below the upper band, therefore $5.55 constitutes the upper reference level. The daily ATR14 is at $0.12, which is higher than $0.11 from the previous trading day.
For the next trading day, the daily pivot point is at $5.52, with the first resistance level at $5.57 and the first support level at $5.44. Since the closing price was below the pivot point, a bullish scenario still requires a breakthrough above that level first.
A strong hourly chart does not solve the problems of the daily chart.
Hourly Line Average and Momentum
In contrast, the hourly chart readings are more positive. The closing price is above the 20-hour EMA at $5.44 and the 50-hour EMA at $5.43, but it is still below the 200-hour EMA at $5.56. The shorter-term hourly moving averages support a bullish outlook, while the longer-term hourly moving averages continue to act as upper resistance.
The hourly chart RSI14 shows a value of 62.56, which is above 50 but has not yet entered the overbought zone. The hourly chart MACD line is at 0.03, which is 0.02 higher than the signal line, and the bar chart shows a positive value of 0.01. The price is also located between the middle band (5.44 USD) and the upper band (5.52 USD) of the hourly Bollinger Bands. These readings are biased towards the bulls, but they are not sufficient to change the mixed structure of the daily chart.
15-minute execution level
From an execution perspective, the 15-minute moving average is below today's closing price. The 20-period EMA is at $5.49, the 50-period at $5.46, and the 200-period at $5.44. However, both the 15-minute MACD line and the signal line are at 0.01, and the bar chart shows zero. The RSI14 is at 58.65, which is higher than 50. This supports a short-term trading strategy, but it does not imply that there will be a change in the main daily trend.
Subsequent financial report coverage and conditional scenarios
A report published by Investing.com on Thursday, October 29, 2026, stated that the statutory pre-tax profit from July to September roughly doubled year-on-year to £2.33 billion. This report was released after the trading period that concluded on Wednesday.
On the contrary, if it falls below $5.49, the bullish scenario will weaken. If it further drops below $5.44 – which is the middle band of the daily Bollinger Bands and the first support level for the next trading day – then this support-based judgment will no longer hold. At that point, the lower band of the daily Bollinger Bands at $5.34 will become the new reference level below.
Overall, LYG is situated between the support level of the moving average around $5.49 and the resistance level starting at $5.51, with the daily pivot point for the next trading day being at $5.52. The daily ATR14 is at $0.12, providing a context for volatility.
Frequently Asked Questions
What is the key support level for LYG?
The 20-day EMA level of $5.49 on the daily chart serves as recent support. Below that, the first support level for the next trading day and the middle band of the daily Bollinger Bands are both at $5.44. The lower band of the daily Bollinger Bands, at $5.34, provides further reference.
What resistance levels does LYG face?
The 200-day EMA of $5.51 and the daily pivot point of the next trading day at $5.52 are the first levels of resistance. Above that, the upper band of the daily Bollinger Bands is at $5.55, followed by the first level of resistance for the next trading day at $5.57, as well as the 50-day EMA of $5.64.
What does the hourly timeline for LYG indicate?
The hourly chart is more positive than the daily chart. The price is above the 20-hour and 50-hour EMA levels, with the hourly RSI14 at 62.56, and the MACD bar chart showing a positive value of 0.01. However, the 200-hour EMA level of $5.56 is still above that.
Are there any messages on Wednesday that may affect LYG?
A report published by Investing.com on Thursday, October 29th, indicated that the statutory pre-tax profit from July to September roughly doubled year-on-year. This report was released after the trading hours of Wednesday.
Cryptonomist and the author do not hold any positions in the financial instruments mentioned in this text, nor have they received any compensation from the companies reported.
This article was generated with the assistance of artificial intelligence and has been reviewed by an editorial team.