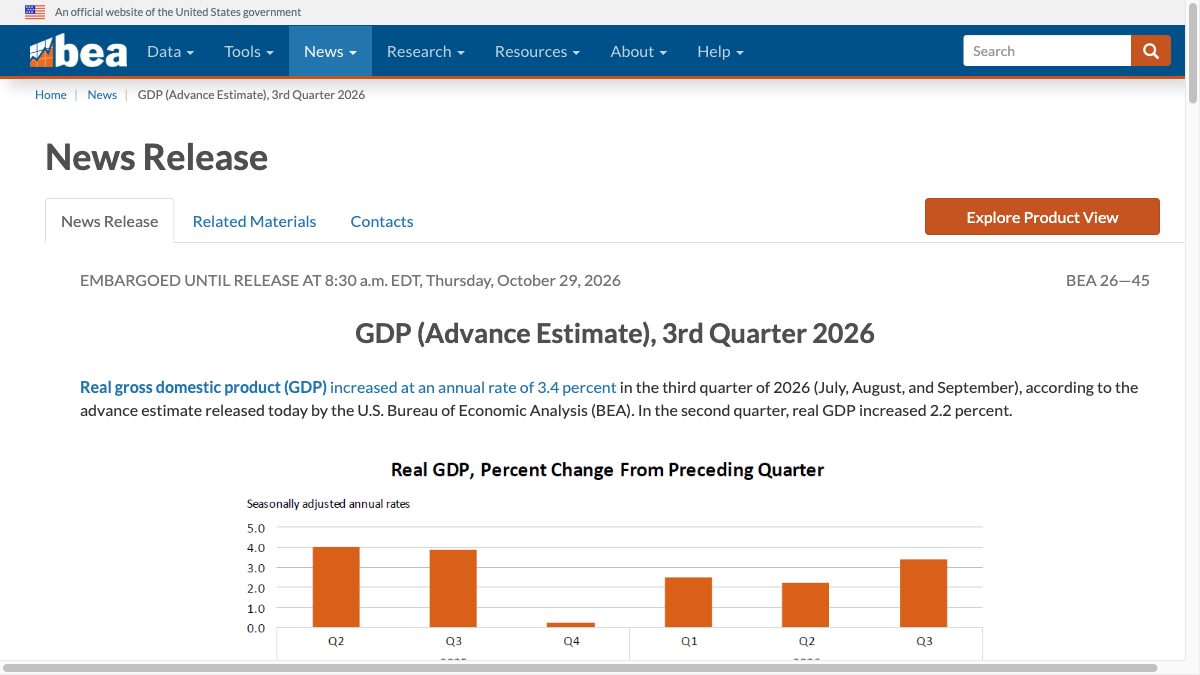


In the third quarter of the United States, real GDP grew at an annualized rate of 3.4%, which is faster than the 2.2% in the second quarter. However, if one interprets it as a 3.4% increase in output over three months, that would be a misunderstanding from the start. The preliminary figures released by the Bureau of Economic Analysis on October 29th provided a quarterly growth rate of 0.8% in the technical notes. The 3.4% mentioned in the headline is the annualized rate after seasonal adjustment, not the growth that has already been achieved for the entire year.
The report shows that increases in investment, household consumption, and government spending were partially offset by a decline in exports, while imports also increased. Compared to the second quarter, the acceleration in growth was mainly reflected in faster investment and a rise in government spending, whereas exports shifted from growth to decline. Taken together, these factors better describe what occurred during that quarter than a simple label of "economic acceleration."
Importations are deducted in the calculation of GDP; this is the accounting arrangement for this report, and it should not be directly interpreted as meaning that increased imports are necessarily harmful. The technical description mentions that the greatest contribution to the increase in imports comes from capital goods other than automobiles; moreover, the growth in equipment investment is mainly driven by information processing equipment, which includes computers and peripheral devices. Equipment purchases and imports may both increase simultaneously; therefore, one should not dismiss the other aspect of activity just because there is a negative sign in one category.
Investment has increased, so it's necessary to separate equipment from inventory.
The increase in investment mainly reflects private inventory investment and an expansion of equipment. A significant contribution to this inventory growth came from wholesale and manufacturing sectors, both led by the non-durable goods industries, based primarily on data on inventory from the Census Bureau. If all investment is attributed solely to enterprises building new production capacity, then this portion of inventory changes would be overlooked.
For equipment items, data such as goods import and export and the preliminary economic indicators for September are mainly used. For readers concerned about corporate demand, the two types of investment provide different information: the entry of equipment into use corresponds to the purchase of production tools, while the accounting of inventory first describes the accumulation of goods on the account. The announcement does not provide sufficient information to directly classify this inventory as either proactive stockpiling or unsold goods.
Another aggregate measure helps avoid focusing solely on inventory. Private domestic buyer actual final sales, the sum of consumption expenditure and private fixed investment, grew at an annualized rate of 4.9% in the third quarter, compared to 4.6% in the second quarter. This has a different scope than GDP, so 4.9% cannot replace 3.4%; however, reading both together shows that demand from household and business fixed investment has also strengthened.
Consumption comes from both services and goods. In terms of services, medical facilities such as hospitals and outpatient clinics, as well as catering and accommodation, play a major role in driving consumption; among goods, prescription drugs are particularly prominent as a driver of non-durable consumer goods. To explain the entire quarter as "consumers buying more durable goods" would deviate from the official sources of contribution listed.
Less oil is sold, yet government spending has increased instead.
The most easily misunderstood information in this case is hidden in the explanation of federal non-defense spending. The GDP account deducts sales from strategic oil reserves from government consumption. Less oil was sold in the third quarter than in the second quarter, so the deduction decreased, and as a result, government consumption expenditure increased. This positive growth cannot be directly interpreted as the government initiating a new round of purchases of the same scale.
The Economic Analysis Bureau also made it clear that the government's oil sales are reflected in other components of GDP. Therefore, this accounting method has no direct impact on GDP. If one were to infer that changes in the sale of reserve oil have created overall growth merely by examining the increase in government spending, such an interpretation would mistake the transfer of funds between different items for an addition to total output.
This also explains why it is necessary to refer to technical specifications when reading macro reports. For the same category of expenditure, such as equipment, medical services, and oil reserves, the associated corporate revenues and policy implications are not the same. Although the names of these sub-items may be similar, economic actions cannot be substituted by their names alone.
In terms of prices, the total domestic purchase price index rose by 3.0% on a year-on-year basis in the third quarter, compared to 5.6% in the second quarter; the PCE price index decreased from 5.0% to 2.1%, and after excluding food and energy, it fell from 3.3% to 2.5%. These are all quarterly annualized rates and should not be directly compared with the year-on-year figures in the monthly reports. Nor can we conclude that the price issue has ended just because of this slowdown in the current quarter.
This data is still at its initial value, and the next update is scheduled for November 25th, when corporate profits will also be announced. For now, what can be confirmed is that growth is accelerating, and private final demand is strengthening. At the same time, exports, inventory, and government accounting have different effects. For those who allocate funds or assess orders, the change lies in the narrowing of the evidence base: 3.4% provides the overall figure, and it is the actual purchases and statistical movements that support this figure, which determine which growth trends are worth extrapolating.