

XRP What are the issues with the November statistics?
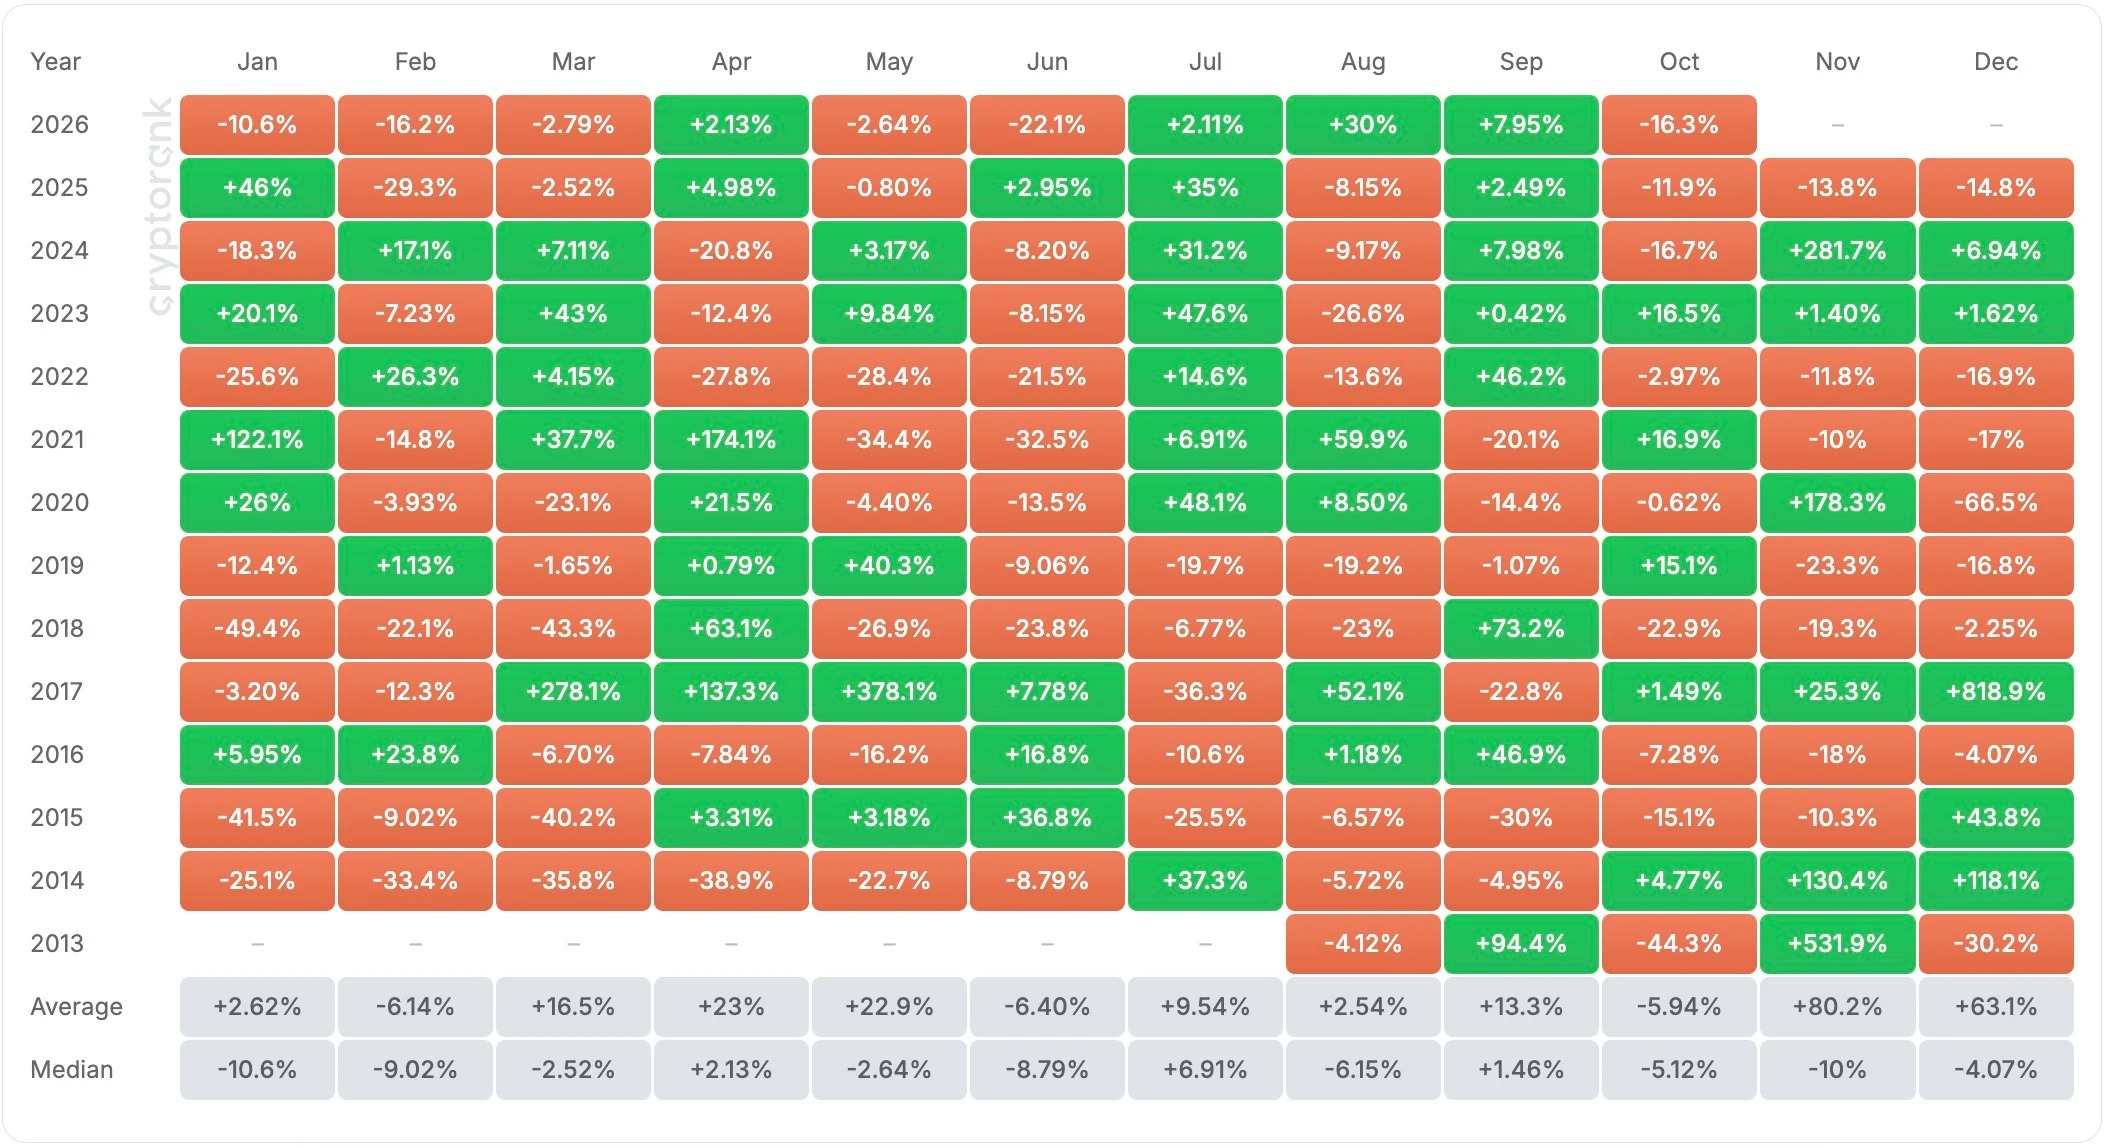
The biggest trap in the market lies in the asymmetry of returns. According to the data from Cryptorank, the average increase in XRP in November was as high as 80.2%, but this figure is completely distorted by two isolated outliers: a 531.9% increase in 2013 and a 281.7% increase in 2024. What better reflects reality is that the median for that month was -10%.
Historically, in most cycles, XRP has been in a downward trend at the end of November. The fourth quarter currently only includes October, and October has already seen a decline of 16.3%, which is consistent with the seasonal pattern of this asset tending to correct downwards, a trend that is obscured by the average statistical data.
However, the median is not a perfect indicator either: the sample size of 13 is too small, and the market structure has already changed. Since mid-November 2025 when the US introduced the spot XRP ETF, this token has gained institutional demand channels that were not present during the early stages.
As of the end of October, the real forces in the market further reinforced this mathematically pessimistic assessment. The price has fallen below the key support level of $1.30, and currently trades around $1.25 to $1.26, indicating a local downward trend. XRP
The upward momentum, which was built on investors' expectations, has subsided, creating an opportunity for short-term traders to realize profits. It is noteworthy that the decline in October occurred after a 48% increase in the third quarter, which was also XRP's best third quarter in four years. This indicates that at least part of the current pressure comes from profit-taking after the rise, and not just seasonal factors.
When liquidity is insufficient, an increase in supply is almost inevitable, which further exacerbates the situation. On Sunday, November 1st, Ripple, 1 billion XRP will be unlocked as planned from the entrusted wallets.
It should be noted, however, that this custody unlocking is a routine monthly event that has followed the same schedule since 2017. Ripple typically reinvests 600 million to 800 million of XRP into the new custody contract. Therefore, the actual net increase in the circulating supply is closer to 200 million to 400 million of XRP.
Even so, against the backdrop of relatively low liquidity, this volume is still sufficient to exert additional pressure on prices, as it will enter the market at the same time as macroeconomic pressures and the aftermath of a recent round of forced liquidations. Previously, due to a security incident at the Binance exchange, long positions worth over $1.29 billion were forcibly liquidated.
At the same time, this round of liquidation has also removed some of the excess leverage in the market to a certain extent. If funding rates remain negative and open positions are not closed, then the bearish scenario may be constrained by short squeezes, which could increase the likelihood of prices testing levels between $1.30 and $1.32 again, above what the statistical data suggests.
After removing historical outliers, the chart indicates two possible scenarios:
- Downward path: If the range between $1.20 and $1.17 is breached, it will directly open the way to the psychological level of $1.00 as well as the local low of $0.98.
- To restore bullish momentum, buyers need to push prices back above the $1.30 to $1.32 range and maintain that consolidation at the close of the weekly chart.