












Key Points
- Cardano ( ADA ) traded below $0.20 on Monday, with a cumulative decline of 21% in October. The support level is around $0.1894.
- Technical indicators remain bearish. If it falls below $0.1894, it could further decline to $0.1712 and $0.1537.
Cardano ( ADA ) It remains difficult to regain upward momentum on Monday. After a tough October that saw its market value evaporate by 21%, the price is still below $0.20.
This cryptocurrency is currently holding above the support level of $0.1894, but the decline in whale holdings and the weakening of derivatives activity indicate that buyers are still reluctant to return.
ADA has been relatively stable since a nearly 8% sell-off last Thursday, but there are almost no signs of a meaningful rebound taking shape.
On-chain data from Santiment shows that large investors in Cardano have reduced their holdings over the past month; data from CoinGlass indicates a significant decrease in open futures contracts.
However, the increased market attention has not translated into stronger buying behavior from the largest holders of Cardano.
Santiment data shows that wallets holding between 10 million and 100 million ADA currently control approximately 37.45% of the circulating supply, which is lower than the 38.03% from last month.
This decline indicates that some major investors have reduced their exposure during the recent period of weakening prices, rather than continuing to increase their holdings of tokens.
Whale activities are closely monitored because large holders may affect market liquidity and price volatility when overall demand is already weak.
The supply in a profitable state for Cardano has also decreased significantly, from 28.36% to 14.77%. This indicates that the proportion of the circulating supply held in a profitable state has notably reduced, reflecting the impact of the recent decline in ADA. However, this single indicator alone cannot determine how much of the fluctuation is due to profit-taking.
If large holders continue to reduce their positions, Cardano may find it difficult to recover from the decline in October.
The weakness in the spot market is also reflected in derivatives activities. CoinGlass Data shows that the number of open futures contracts has dropped to approximately $419 million, lower than last week's $450 million. ADA
This means a decrease of about 11%, indicating that traders are closing their positions faster than they are opening new ones.
Unclosed contracts represent the total number of futures contracts that have not yet been settled or closed.
A decrease in open contracts usually indicates a lower level of market participation, or that leveraged positions are being closed more broadly.
As for Cardano, this contraction, along with the decline in prices and a reduction in whales' positions, indicates that traders are still cautious about opening new positions.
The combination of weakened derivatives activity and a decrease in increases by large holders results in ADA lacking a clear source of buying momentum.
If unclosed contracts continue to rebound and are accompanied by rising prices, it may be an early signal that traders are more willing to take risks.
Cardano Price Forecast: ADA Faces bearish pressure below $0.20
On Monday, Cardano continued to trade below the psychological level of $0.20, with the daily chart indicating that sellers still held the upper hand.
ADA is currently 0.2179 USD below the 50-day moving average (EMA), and also 0.2408 USD below the 200-day EMA.
Both of these moving averages act as resistance above, making it difficult for buyers to establish a sustained rebound.
The cryptocurrency also broke below its previous upward support trend line, with a price level close to $0.2019.
This significant break below the support level is crucial, as once the price falls below it, what was once a support level often becomes a resistance level.
Unless ADA regains this trend line, subsequent rebound attempts may once again face selling pressure.
The momentum indicators also provided little encouragement to buyers. The daily relative strength index ( RSI ) hovered around 31, close to the oversold threshold of 30.
Although RSI, which is close to the oversold area, sometimes indicates a short-term rebound, it also reflects the intensity of selling pressure in recent times.
At the same time, MACD is still below the zero axis, reinforcing the bearish momentum on the daily chart.
Overall, these indicators suggest that ADA has not yet formed a convincing bullish reversal.
What traders are currently most concerned about is the support level of $0.1894, which corresponds to the low point on August 30th.
Despite the recent decline, ADA has managed to hold this area. However, if another wave of selling occurs, it could put pressure on this position.
If the daily close falls significantly below $0.1894, it will weaken the short-term technical outlook and may open the door for a decline to $0.1712, which corresponds to the low point on August 18th.
If the sellers continue to hold the dominant position, the next important support level is around $0.1537, which was previously tested on July 27th.
If it falls into that range, it would mean a further extension of the downward trend for Cardano in October.
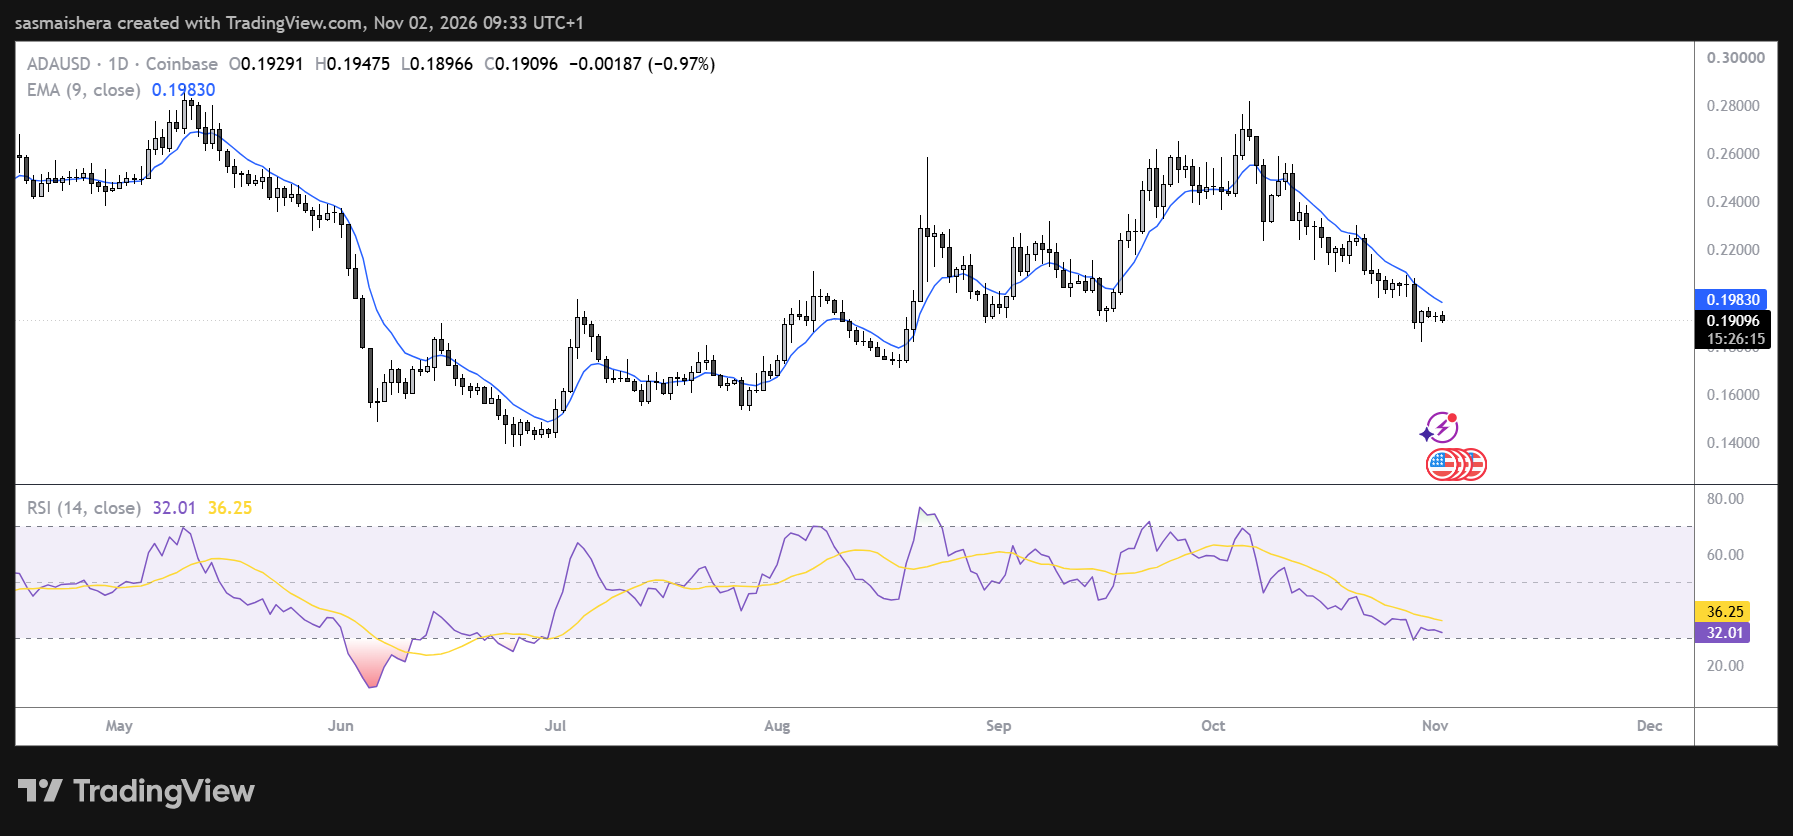
On the upside, buyers must first push ADA back above the trend line of $0.2019, which has already been breached, in order to improve the short-term outlook.
If it can continue to maintain this level, it may enable this cryptocurrency to challenge the 50-day EMA of $0.2179.
Further up, the $0.2408 level of the 200-day EMA remains a significant resistance for further rebound.
Until ADA recovers these resistance levels, the technical outlook is likely to remain bearish.