【Related Reading】US stocks suffer epic selling pressure; the "Fibonacci Half Index" records its largest single-day decline in nearly 7 years
U.S. stocks suffer a heavy blow; the NASDAQ 100 index loses $2.3 trillion in market value during the plunge
Wall Street has been shrouded in the shadow of fear for months. Then, in an instant, everyone rushed out in a panic.
The sharp decline in the stock market on Thursday began shortly after the opening of the New York Stock Exchange, and then things got worse and worse. Almost all stocks tumbled, ranging from chip manufacturers like NVIDIA, which were once very prosperous, to defensive sectors similar to Walmart.
The companies that have been hit the hardest are those at the core of the artificial intelligence boom. Earlier this year, AI transactions drove the stock market to new highs, but they also sparked concerns about a bubble that would eventually burst.
On Thursday, there was a sudden sharp drop in prices. The reason for this is that investors believe that a decisive victory for the Democratic Party in the congressional elections could lead to a change in political landscape, which in turn could dampen the rapid growth of this industry, resulting in billions of dollars invested in computer equipment that supports this industry being lost.
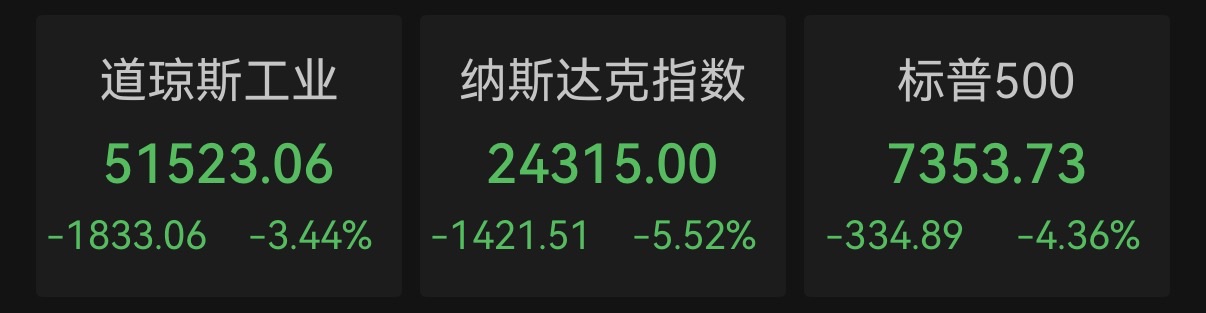
At the close of trading, the Nasdaq 100 index fell by more than 6%, recording the largest decline since March 2020 during the COVID-19 pandemic.
NVIDIA, the world's largest company by market value, tumbled more than 9%, experiencing the biggest decline since January 2025 and wiping out all of its gains this year.
All 30 constituents of the Dow Jones Industrial Average fell, the S&P 500 index declined by 4.4%, and the highly watched semiconductor stock index tumbled 12%, recording the largest single-day drop since the outbreak of the pandemic. As rumors of hedge funds reducing their positions gained momentum, a fund that heavily invests in so-called momentum trading, ETF, experienced its worst day in over a decade, with investors flocking to U.S. Treasury bonds in search of safety.
“I feel as if I’ve gone back to 2008 or even 2001,” said Greg Taylor, the Chief Investment Officer of PenderFund Capital Management. “We’re too focused on a single theme and its subsequent collapse. I think this is inevitable, because our attention to artificial intelligence is too high, and its proportion in the market is also too large.”
The following five charts show the extent of volatility in the stock market on Thursday:
The Nasdaq 100 index continued to decline, with a market value evaporating by $2.3 trillion, representing a drop of nearly 15% from its record high on October 6th.
A rapid reversal dealt a heavy blow to iShares and MSCI USA Momentum Factor ETF, which adopted momentum trading strategies; they both fell by 8.2%, recording the largest single-day decline since 2020.
The Philadelphia Semiconductor Index tumbled 12%, recording the largest one-day decline since March 2020, and fell more than 38% from its peak on June 22, entering a bear market.
The Chicago Board Options Exchange Volatility Index ( VIX ) soared by 11.57 points, closing at 28.18 points, reaching its highest level since March. This is the largest single-day point increase since 2018.
In addition, the gap between spot prices and three-month futures prices has widened to its widest level since April 2025. This is usually a sign of increasing panic among investors and a precursor to further price declines.