











As shown on the Binance SOL / USDT daily chart of TradingView, as of 7:22 PM on November 5th ( UTC ), SOL was trading at $89.47, a decrease of 6.42% from the still-unconcluded trading session, and it once touched $88.76 during the session.
The earlier support level in October was already breached. On October 16th, the trading price of SOL was around $104.47, while the support level near $99 on the weekly chart was still below that price. By October 29th, the token had fallen below $100, making the rebound in September increasingly dependent on lower support levels.
Solana oversold; RSI faces a continuous downward trend
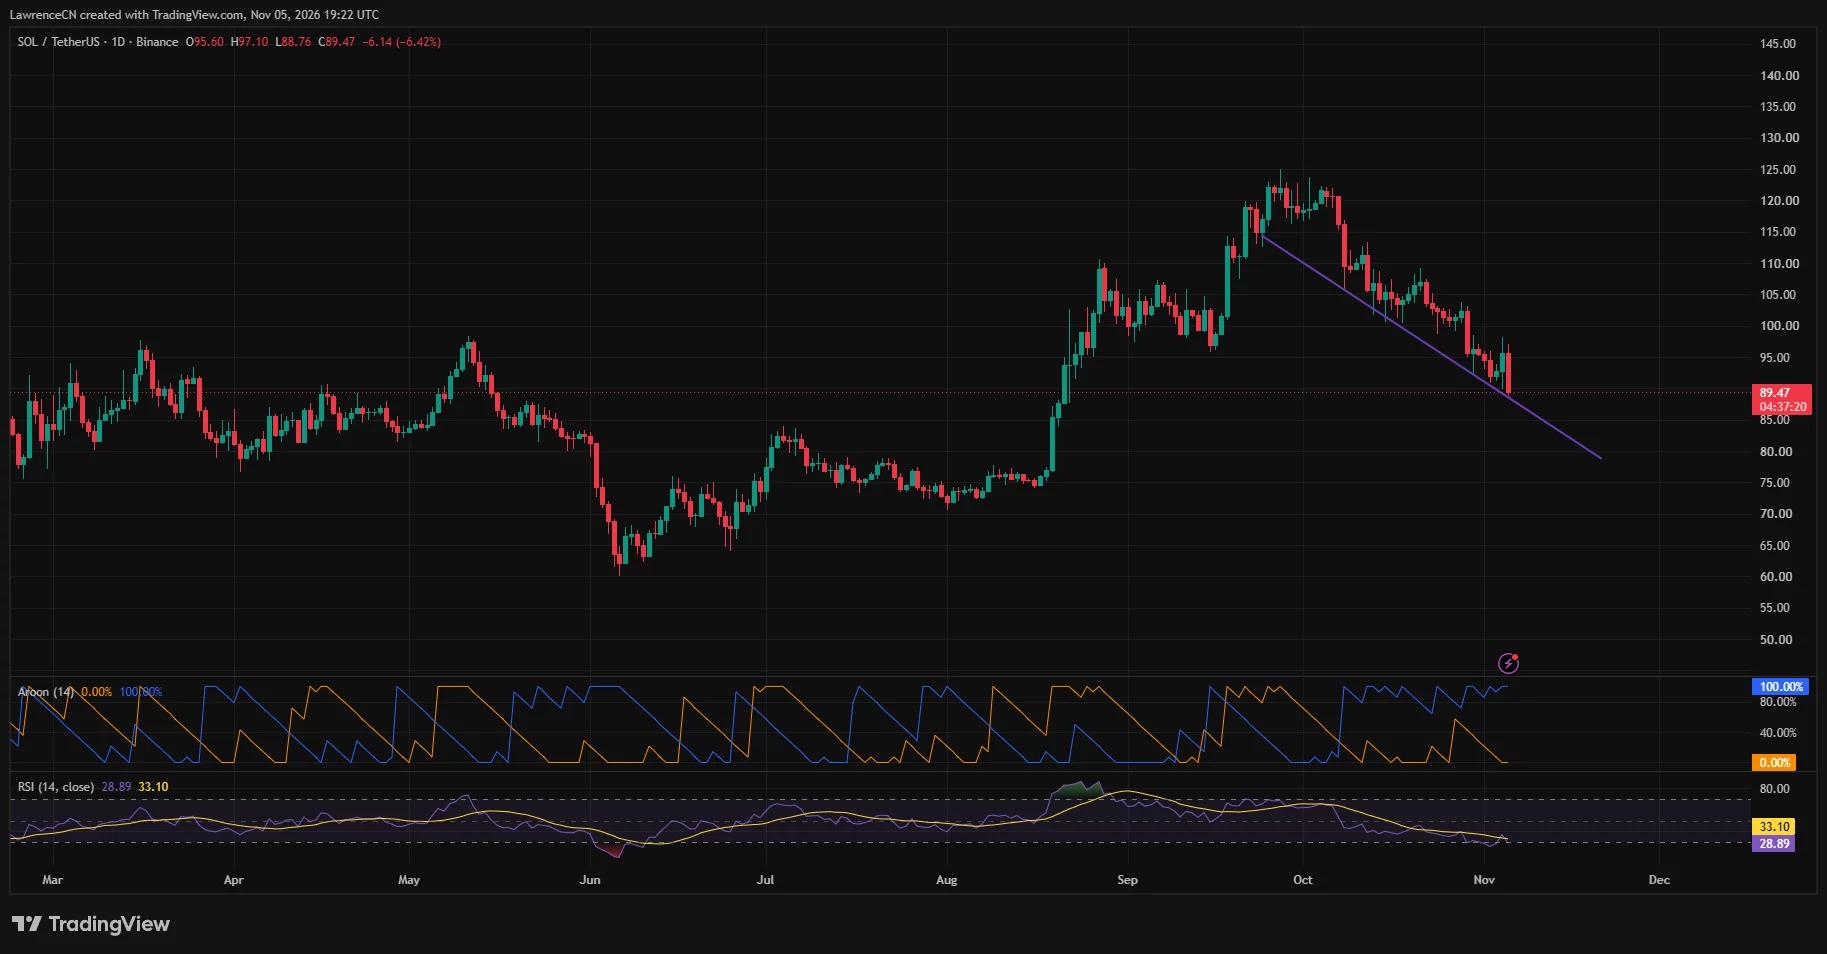
The current price is touching a purple downward trend line drawn below the decline from October. A rebound from this line would preserve the current chart boundaries, but the failure to hold above this line on multiple occasions indicates that buyers need to regain the prices they have lost recently.
The daily line RSI is at 28.89, below its moving average of 33.10. This reading puts SOL in an oversold zone, indicating that there is room for a temporary rebound in prices, but it does not mean that the downward trend has ended. RSI has been below the central axis for most of October, and each subsequent rebound has gradually lost momentum.
The Aroon indicator also shows a similarly weak structure, with a downward trend component of 100 and an upward trend component of 0. New lows continue to dominate the measurement window of this indicator, further reinforcing the downward price trend.
Trader XO also described a similar issue in their analysis of Solana, stating that the daily range continues to move downward and there are no signs of a bottom formation, while the weekly level is now becoming a resistance level.
“Why fight the trend,” he wrote.
Solana You need to recover $93 first before you can challenge for $98.
Trader RED posted earlier on November 5th that when the trade of SOL was around $95 to $96, the resistance was at $97 to $98. He stated that if the four-hour close could stand above this area and then successfully backtest, it would enhance the possibility of a price surge to $100.
“Until SOL breaks above $98 and holds , I’m treating this as a recovery rather than a confirmed trend reversal ,” he wrote.
Therefore, a return to the range of $92.50 to $93 would recover the recently lost territory. If it can further break through $95, there is hope that that failed intraday rebound will come back into focus. However, in the view of RED, $98 still appears to be a stronger confirmation level. Calculated from $89.47, a rise of about 9.5% is required to reach $98.
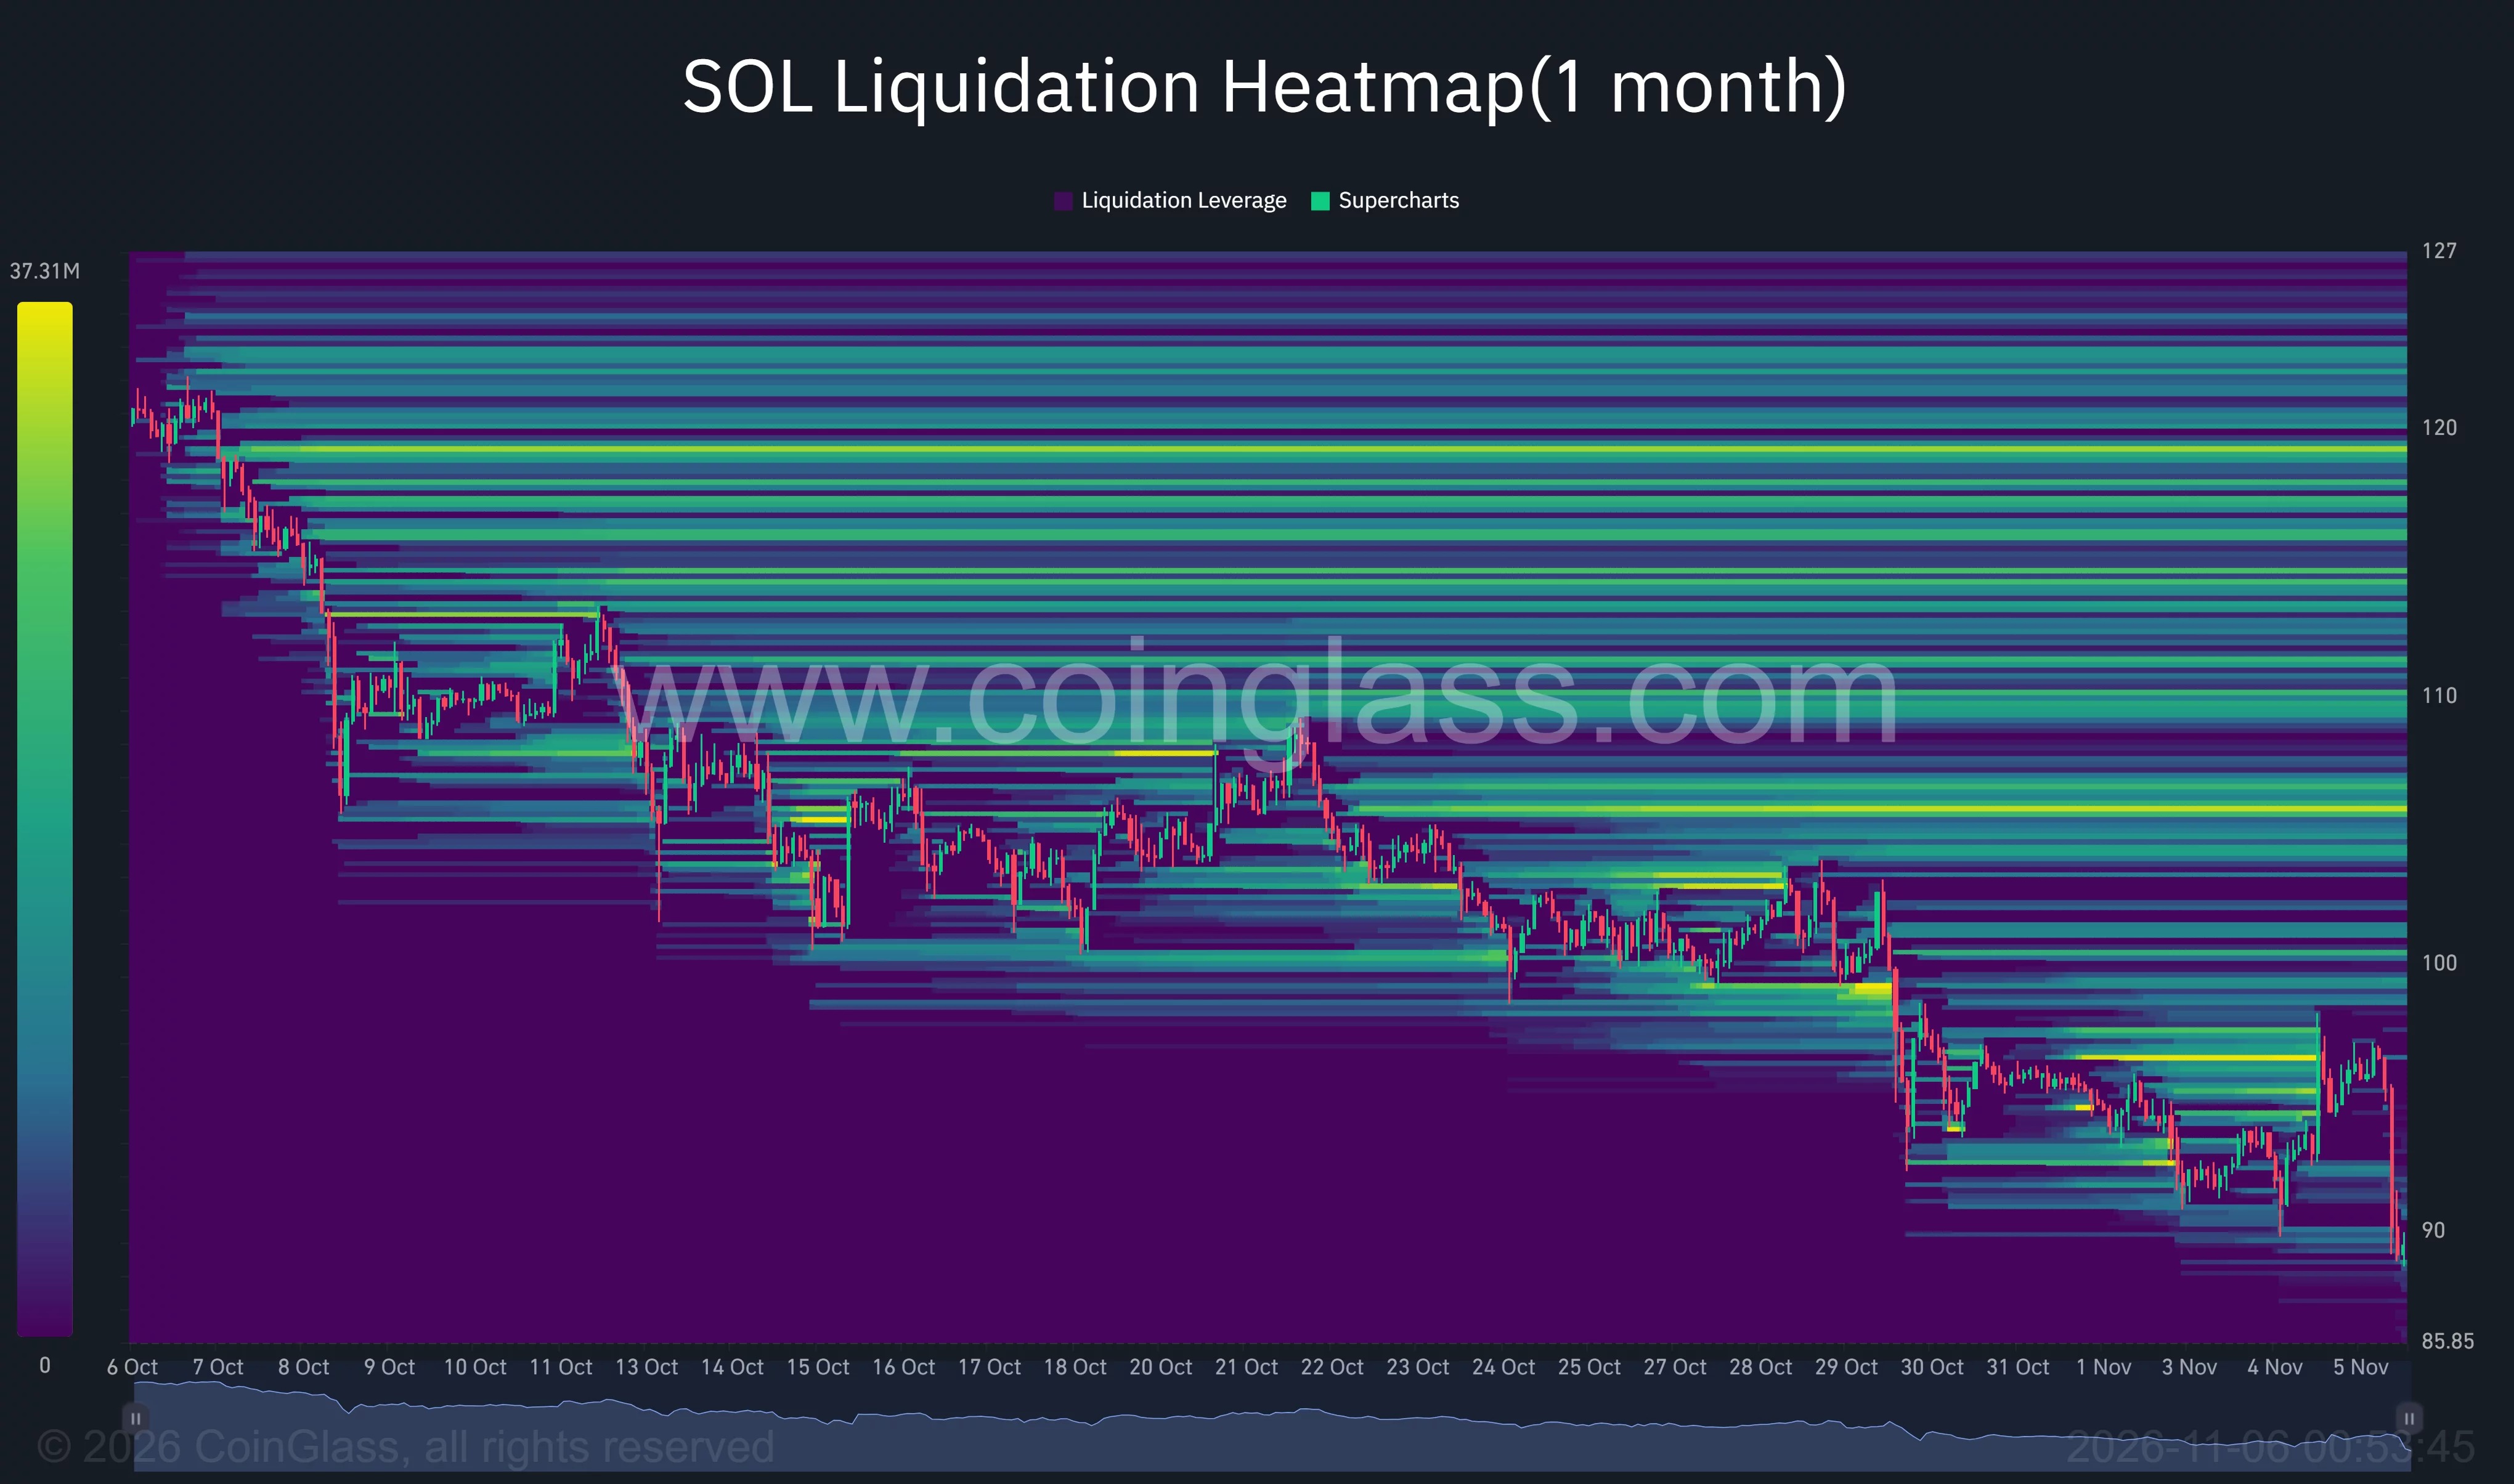
The one-month heat map of CoinGlass shows that the concentrated areas in the upper vicinity are between $92 and $97, as well as between $99 and $101. Stronger ranges are located between $105 and $106 and between $109 and $110, which indicates that there are more leveraged positions above the current resistance levels.
On the weekly chart, SOL traded at $89.53, with the unfinished weekly candle showing a decline of 5.29%. The weekly RSI was at 45.17, below its average of 54, indicating that momentum has weakened after the rise in September.
The current green Supertrend line is located at $84.39 below the price. If the weekly close falls below this moving threshold, the bullish reading for this indicator will be at risk. Calculated based on the daily snapshot around $89.47, this level is approximately 5.7% lower.
Looking further down, the daily chart shows that an earlier consolidation range was around $75 to $80; SOL traded in this area before the breakout in August. The deeper low point from June was close to $62, which is far below the current weekly support level.
Disclosure: This article does not constitute investment advice. The content and materials displayed on this page are for educational purposes only.