

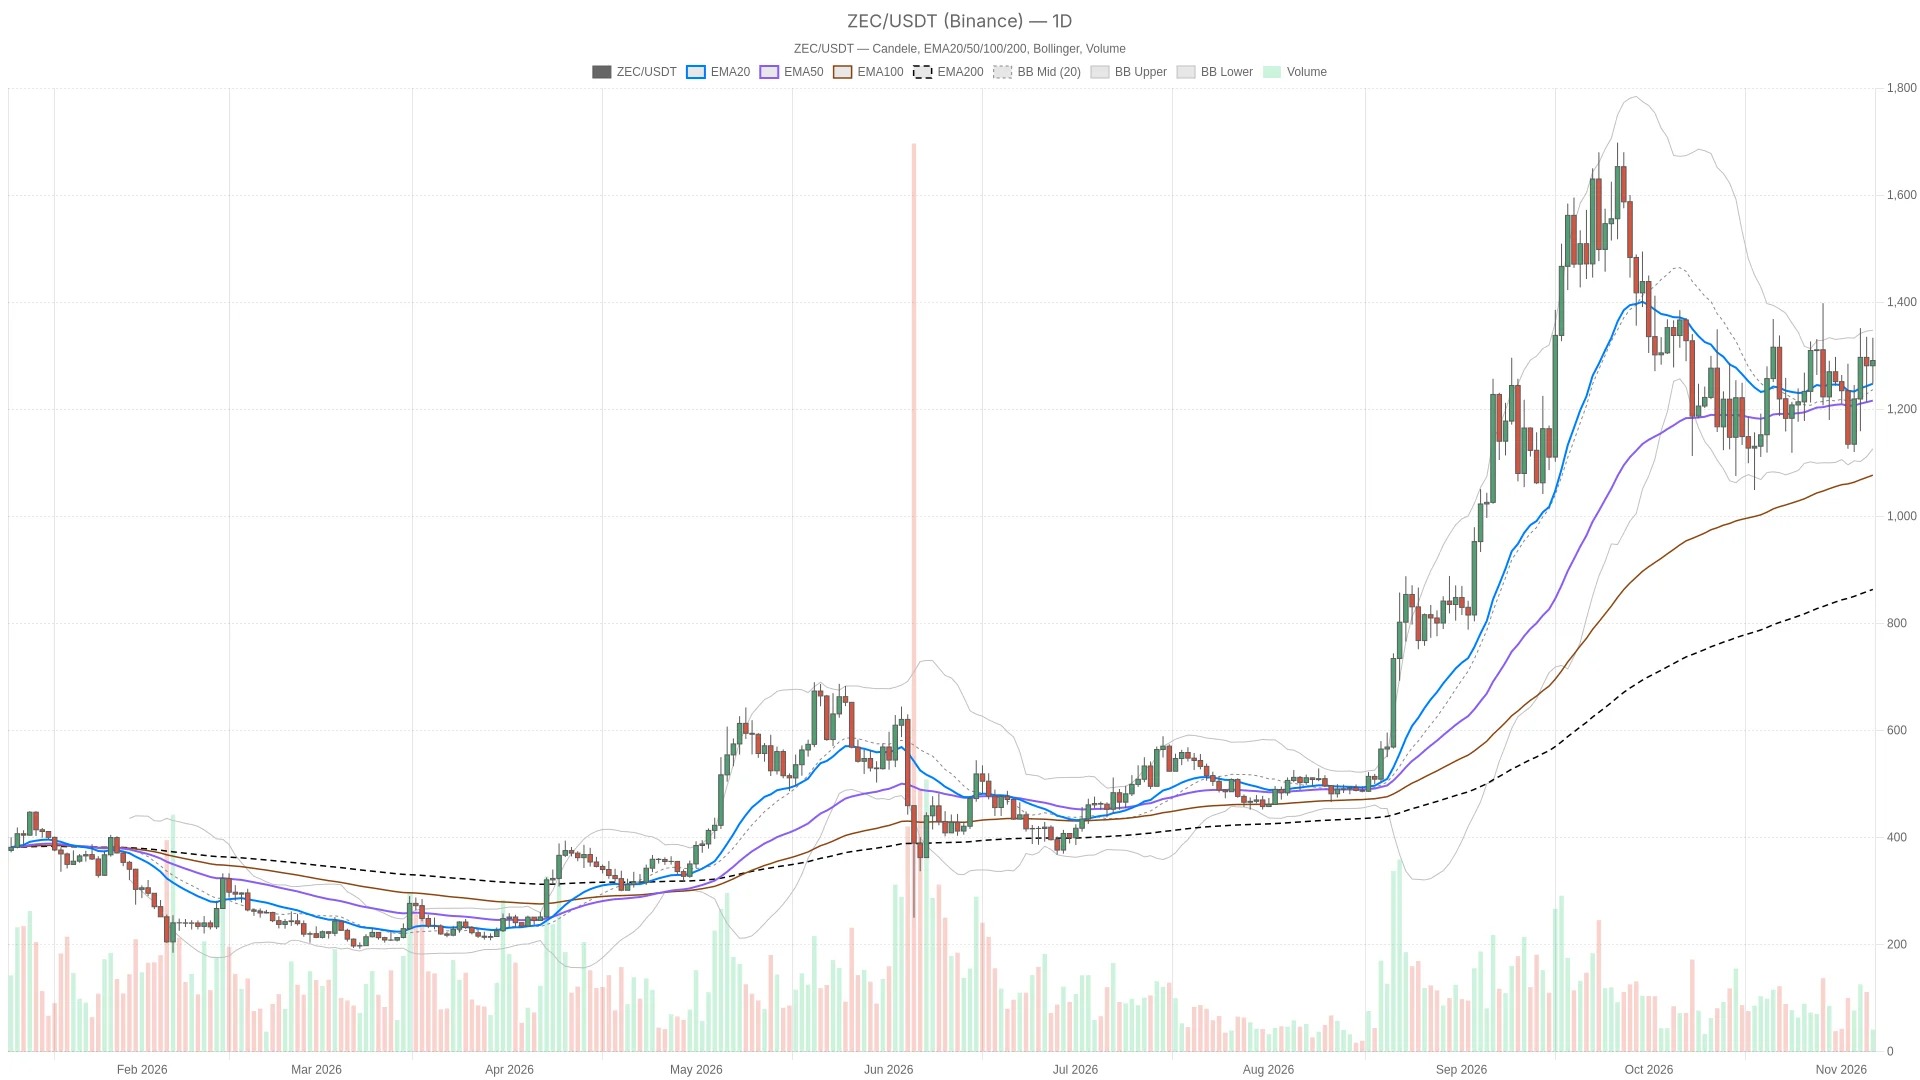
As of November 6, 2026, the price of Zcash still maintains a bullish bias on the daily chart. However, the current real-time increase is ahead of the confirmation on the completed hourly K-line charts. The daily data of ZECUSDT for Binance shows that it is trading at $1290.97, which is above all three moving averages.
Key Points
- Zcash reports $1,290.97, higher than three bullish moving averages arranged in a row.
- The daily MACD bar chart has turned positive, but the hourly MACD momentum is weakening.
- Bullish trigger condition: The hourly close must be above $1321.94; Bearish trigger condition: The daily close must be below $1276.55.
- The Fear and Greed Index is at 28, providing a somewhat defensive macroeconomic backdrop for a bullish outlook.
- NU7 The upgrade will reduce the block generation time to one-third of the original, but it cannot be confirmed alone as a breakthrough.
The price scenario depends on the nearby support levels and hourly resistance levels. The closest confirmed bullish trigger condition is when the hourly close exceeds $1321.94; a bearish scenario would start when the daily close falls below the daily pivot point of $1276.55. If the hourly close exceeds the upper band of the hourly Bollinger Bands at $1321.94, it will confirm a breakout above the recent upper level. This will bring the daily R1 level of $1339.78 into focus, followed by the upper band of the daily Bollinger Bands at $1345.96. If the hourly close falls below the hourly EMA20 level of $1276.59, then this continuation pattern will be invalidated.
If the daily close falls below the daily pivot point of $1276.55, it will weaken the bullish bias and expose the $1243.11 level of the daily EMA20. The next downside reference point is the middle band of the daily Bollinger Bands at $1228.58. If the daily price then recovers above $1276.55, this breakdown can be negated. The previous completed daily candlestick closed at $1281.11, so the bearish trigger conditions have not been met yet.
The hourly level of $1268.16, denoted by R1, has fallen below the current real-time price, and therefore should be classified as a support level rather than a breakout level. The hourly pivot point of $1262.41 is also a lower reference level. Neither of these levels should be confused with the daily pivot point.
The most likely false signal in this structure is when the price extends upward during the session but fails to hold that level at the end of the hour. The hourly market reported a price of $1291.39, but the previous completed hourly candlestick closed at $1257.19. Since the daily ATR level is $117.50 and the hourly ATR level is $28.41, the evidence for a breakout above these levels is weak without also holding that level at the close. These fluctuation ranges also indicate that there could be a sharp reversal in price, but it may not immediately break the daily trend.
RSI is relatively balanced, but the daily and hourly lines MACD are not consistent.
This structure does not represent a completely synchronous breakthrough: the daily RSI indicates 52.8, supporting a moderate bullish trend, while the daily MACD bar chart has turned positive; however, the hourly MACD momentum is still weakening.
RSI represents room for improvement, rather than strong confidence.
The daily RSI is at 52.8, indicating that the market has only a mild bullish advantage, rather than an overbought rise. The hourly RSI is at 44.3, which means that the completed hourly momentum is weaker than the daily structure. The 15-minute RSI has risen to 53.2, supporting the current rebound, but it is not yet sufficient to confirm broader momentum consistency.
MACD Distinguishes between daily line repairs and weak performance on the hourly level
The daily MACD bar chart has turned from negative to positive and continues to rise, which strengthens the case for a continuation of the bullish trend. However, the MACD line itself is still slightly below the zero axis. On the hourly chart, the negative bar charts are expanding: although the real-time price is above the moving average, the momentum is deteriorating.
On the 15-minute chart, the bar chart shows a positive trend and continues to expand, but the MACD line is still below the zero axis. In fact, the shortest time frame supports a rebound, rather than evidence of an already concluded hour-long weakness.
Neatly arranged moving averages face short-term stretching
All three moving averages are in a bullish alignment, and the price is above each of them, which constitutes the strongest structural evidence of a bullish trend. However, the 15-minute chart indicates that there has been some short-term stretching, so caution is needed.
The daily line EMA20 is at $1243.11, EMA50 is at $1213.10, and EMA200 is at $859.06; all three are in a bullish arrangement, and the prices are above them. This represents the strongest structural evidence supporting a bullish bias for Zcash. The hourly moving averages are also in a bullish arrangement, with prices above $1276.59 for EMA20, $1273.97 for EMA50, and $1253.08 for EMA200. The discrepancy lies between the supportive structure and the weaker hourly momentum, rather than between two trend charts that are both bearish.
On the 15-minute chart, the price is above three EMA, but the moving averages are not neatly aligned. Therefore, the current rebound is more mature at the price level than at the trend structure level.
The daily Bollinger Bands range is from $1,111.19 to $1,345.96, with the middle band at $1,228.58. The price is located in the upper half of this range but has not yet touched the upper band, so there is still room for movement. In contrast, on the 15-minute chart, the current price of $1,291.25 is already above the upper Bollinger Band of $1,280.86. This indicates that the short-term trend is in an extended state, rather than an independent confirmation of a sustained breakout.
NU7 brings about network catalysis, but it is not a technical confirmation.
Fear sentiment cools down the bullish daily chart pattern
The Fear & Greed Index is at 28, while dominance is at 59.24%, which provides a cautiously bullish macro environment for the daily chart structure. The Fear & Greed Index for Alternative.me is also at 28, classified as “Fear”. CoinGecko indicates that the total market value of cryptocurrencies is 2.58 trillion US dollars, with Bitcoin and dominance both at 59.24%. This sentiment reading provides a defensive backdrop for the bullish daily chart structure of ZEC. However, based solely on the dominance rate snapshot, it is not possible to determine a change in direction, nor can it prove that funds are shifting into Zcash.
Frequently Asked Questions
Is the main technical bias of Zcash bullish or bearish?
The daily chart indicates a bullish trend, as the price is above the average daily lines that suggest a bullish outlook. However, the hourly MACD momentum is negative, which prevents it from becoming a completely consistent multi-period signal.
NU7 Has the price breakout been confirmed for the upgrade?
No. This upgrade is merely a background network change; the provided data does not establish a causal relationship between it and price increases, nor can it replace the closing price conditions in the scenario.
What are the key bullish continuation levels that need attention?
A close above the hourly Bollinger Band upper band at $1321.94 will confirm a breakout, with the next target being $1339.78 on the daily chart R1.
This article was generated with the assistance of artificial intelligence and has been reviewed by an editorial team.
Lorenzo Marcek is a financial journalist and senior crypto market analyst, renowned for his clear, data-driven reporting on digital assets. With a background in economics and over a decade of experience covering global markets, he specializes in on-chain indicators, institutional adoption trends, and macroeconomic factors that influence cryptocurrency prices. His work combines investigative journalism with technical market insights, making him a trusted source for traders seeking solid, actionable analysis.