

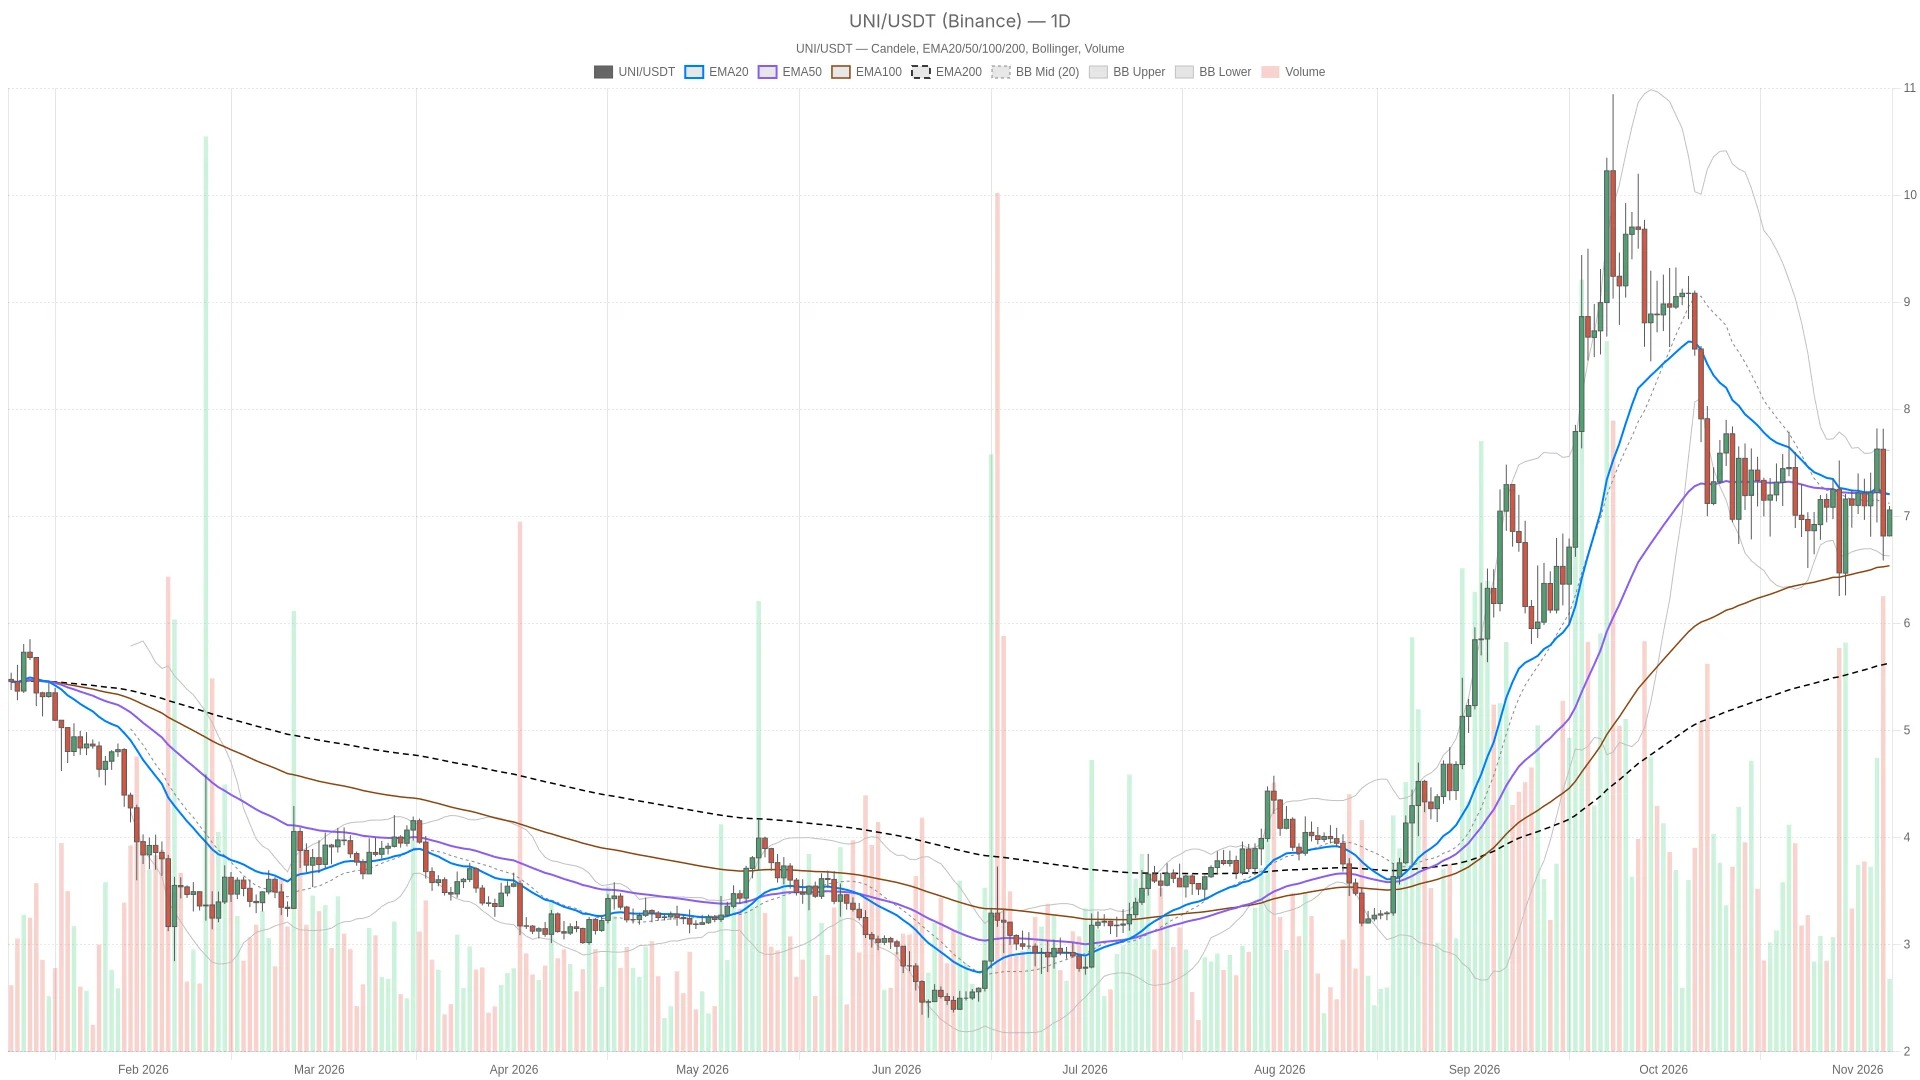
As of November 6, 2026, the trading price of UNI on Binance is 7.06 US dollars. The price trend of Uniswap indicates a mid-session recovery, rather than a confirmed daily reversal. The overall outlook remains neutral with a slight defensive bias: the price is below the 20-week and 50-week EMA moving averages. However, the longer-term moving average structure still suggests a bullish trend.
Key Points
- As of November 6, 2026, UNI traded at $7.06 on Binance, with the daily pivot point of $7.07 constituting the recent resistance level.
- On the daily chart, RSI weakened to 43.9, while the bar chart of MACD remains positive but is flattening out, indicating contradictory momentum signals.
- If the hourly chart closes above $7.07, it will confirm a bullish breakout; if it closes below $6.93, it will reinforce the downward pressure again.
- The most recent completed hourly candlestick closed at $6.97, so the current real-time recovery to higher levels is still only temporary.
A market environment dominated by fear emotions has limited the rebound narrative of Uniswap.
The broader crypto market is currently in a defensive stance. With a total market value of $2.58 trillion, it has declined by 6.44% in 24 hours; the Fear and Greed Index reads 28, clearly indicating a “fear” zone. These figures together create a context that is more cautious rather than one of renewed risk appetite.
At the same time, Standard Chartered Bank suggested that a hacker attack on Binance could potentially be beneficial for Uniswap. This conditional view provides a somewhat constructive narrative, but it does not constitute a direct catalyst for the current trend of UNI. Technical evidence still needs to be analyzed to determine whether this is merely a rebound or a more sustained recovery.
Uniswap The price is still below the daily line, failing to break through the resistance level.
UNI is still below the daily level of 7.22 dollars for EMA20 and 7.21 dollars for EMA50, so the daily trend remains in a neutral range. The daily candlestick data for Binance shows that the price is below these short-term moving averages, but above the daily level of 5.61 dollars for EMA200. The moving averages still maintain a bullish alignment, so the long-term structure has not been broken yet, but the current price is still weak and not sufficient to confirm an immediate bullish trend.
The hourly chart only partially improved this situation. The price is above the hourly EMA20 of $7.02, but below the hourly EMA200 of $7.16 and the hourly EMA50 of $7.17. These moving averages do not form a consistent arrangement, which puts this rebound between short-term correction and the nearby resistance above.
From an execution perspective, the price at 15 minutes is higher than its EMA20 of $6.98 and EMA50 of $6.97, but lower than EMA200's $7.16. This structure is also somewhat mixed, suggesting support for a rebound, but it has not been confirmed that the daily resistance level has been broken through.
Short-term momentum has improved, but the daily RSI trend is weakening.
The daily line RSI is currently on the downward trend, at 43.9; the daily line MACD bar chart shows a positive trend, but it tends to be flatting out. These signals are in conflict with each other: the bar chart provides some constructive support, but RSI does not offer convincing momentum confirmation for the daily line to recover.
The middle band of the daily Bollinger Bands is at $7.13, which still constitutes pressure above. The lower band of the range is at $6.63, and the upper band is at $7.62. The price has not yet re-crossed this range's central axis. On the hourly chart, the price is above the middle band of the Bollinger Bands at $6.93, with the upper band at $7.19 and the lower band at $6.67. This contrast is consistent with the characteristic of "the daily range not yet resolved, but being corrected during the session."
The 15-minute Bollinger Band upper band is at $7.08, which indicates that the current upward movement is approaching its short-term volatility envelope. ATR values are as follows: $0.64 for the daily chart, $0.13 for the hourly chart, and $0.05540 for the 15-minute chart. These volatility ranges mean that a brief breakout near these levels is not as convincing as confirmation through a complete candlestick pattern.
The daily pivot point of $7.07 is the key to distinguishing between a rebound and a stronger recovery.
The daily pivot point of $7.07 serves as a direct demarcation line between intraday rebounds and more sustained recoveries. Below the current hourly real-time price, the $7.04 level from the R1 hour may now turn into support, followed by the $7.02 level from the EMA20 hour, as well as the hourly pivot point of $7.00. However, the most recent completed hourly candlestick closed at $6.97, which is below these levels. Therefore, the current recovery to these levels is still temporary and cannot yet be considered as established support.
Bullish scenario: If the hourly chart closes above the daily pivot point of $7.07, it will confirm a recent upward breakout. At that time, the middle band of the daily Bollinger Bands at $7.13 will become the focus of attention, followed by $7.16 for the hourly EMA200 and $7.17 for the hourly EMA50. If the hourly chart closes back below the hourly pivot point of $7.00, then this corrective structure will be invalidated. Beyond that, the daily resistance levels of $7.21 for the daily EMA50 and $7.22 for the daily EMA20 will still be key obstacles in distinguishing between a normal rebound and a stronger daily correction.
Bearish scenario: If the hourly chart closes below $6.93, which is S1, it will confirm that the weakness has intensified further on top of the already weak previous hourly candlestick. The next downside reference points are the lower band of the hourly Bollinger Bands at $6.67 and the lower band of the daily Bollinger Bands at $6.63, followed by $6.33, which is S1 on the daily chart. If the hourly chart closes above $7.04, which is R1, then this bearish scenario will not come to fruition.
In the end, the most likely false signal is when the price briefly breaks above the daily pivot point during trading hours but fails to sustain that level until the close of the hourly chart. The gap between the improvement in short-term momentum and the weakening of the daily RSI trend makes this distinction particularly important for the short-term outlook of UNI.
Frequently Asked Questions
Has the daily trend of UNI clearly turned bearish?
No. The price is below the daily levels of EMA20 and EMA50, but above EMA200. Moreover, the moving averages still maintain a bullish alignment. This combination supports the judgment of 'neutral on the daily chart, with a slight defensive bias'.
Has the rebound in the market already led to overbuying?
The reading indicated by RSI in the text did not show signs of overbought conditions. The strongest reading appeared on the 15-minute chart, at 60.1; however, this level is still not sufficient to overcome the resistance identified in higher time frames above it.
At what price level can we confirm a bullish breakout for UNI?
If the hourly chart closes above the daily pivot point of $7.07, it will confirm the recent upward breakout. Thereafter, the middle band of the daily Bollinger Bands at $7.13, the EMA200 level of $7.16, and the EMA50 level of $7.21 on the daily chart will become the next set of upward reference points.
What circumstances can cause the current in-game repair to fail?
If the hourly chart closes below the hourly pivot point of $7.00 again, then the current corrective structure will be invalidated. Furthermore, if the hourly chart closes below $6.93, which is the S1 level, it will confirm that downward pressure has strengthened once more.
This article was completed with the assistance of artificial intelligence and has been reviewed by a team of editors.
Lorenzo Marcek is a financial journalist and senior crypto market analyst, known for his clear and data-driven reporting on digital assets. With a background in economics and over a decade of experience covering global markets, he focuses on on-chain indicators, institutional adoption trends, and macroeconomic factors that drive crypto market fluctuations. His work combines investigative journalism with insights into the technology market, making him an important source of practical analysis for traders.