












XRP fell below $1.20 on November 6, putting pressure on its daily and weekly charts. Although analysts pointed out that whales are accumulating positions and that the price may be forming a bottom pattern.
The trading price of XRP is below the four-day moving average, with resistance concentrated in the range of $1.27 to $1.29.
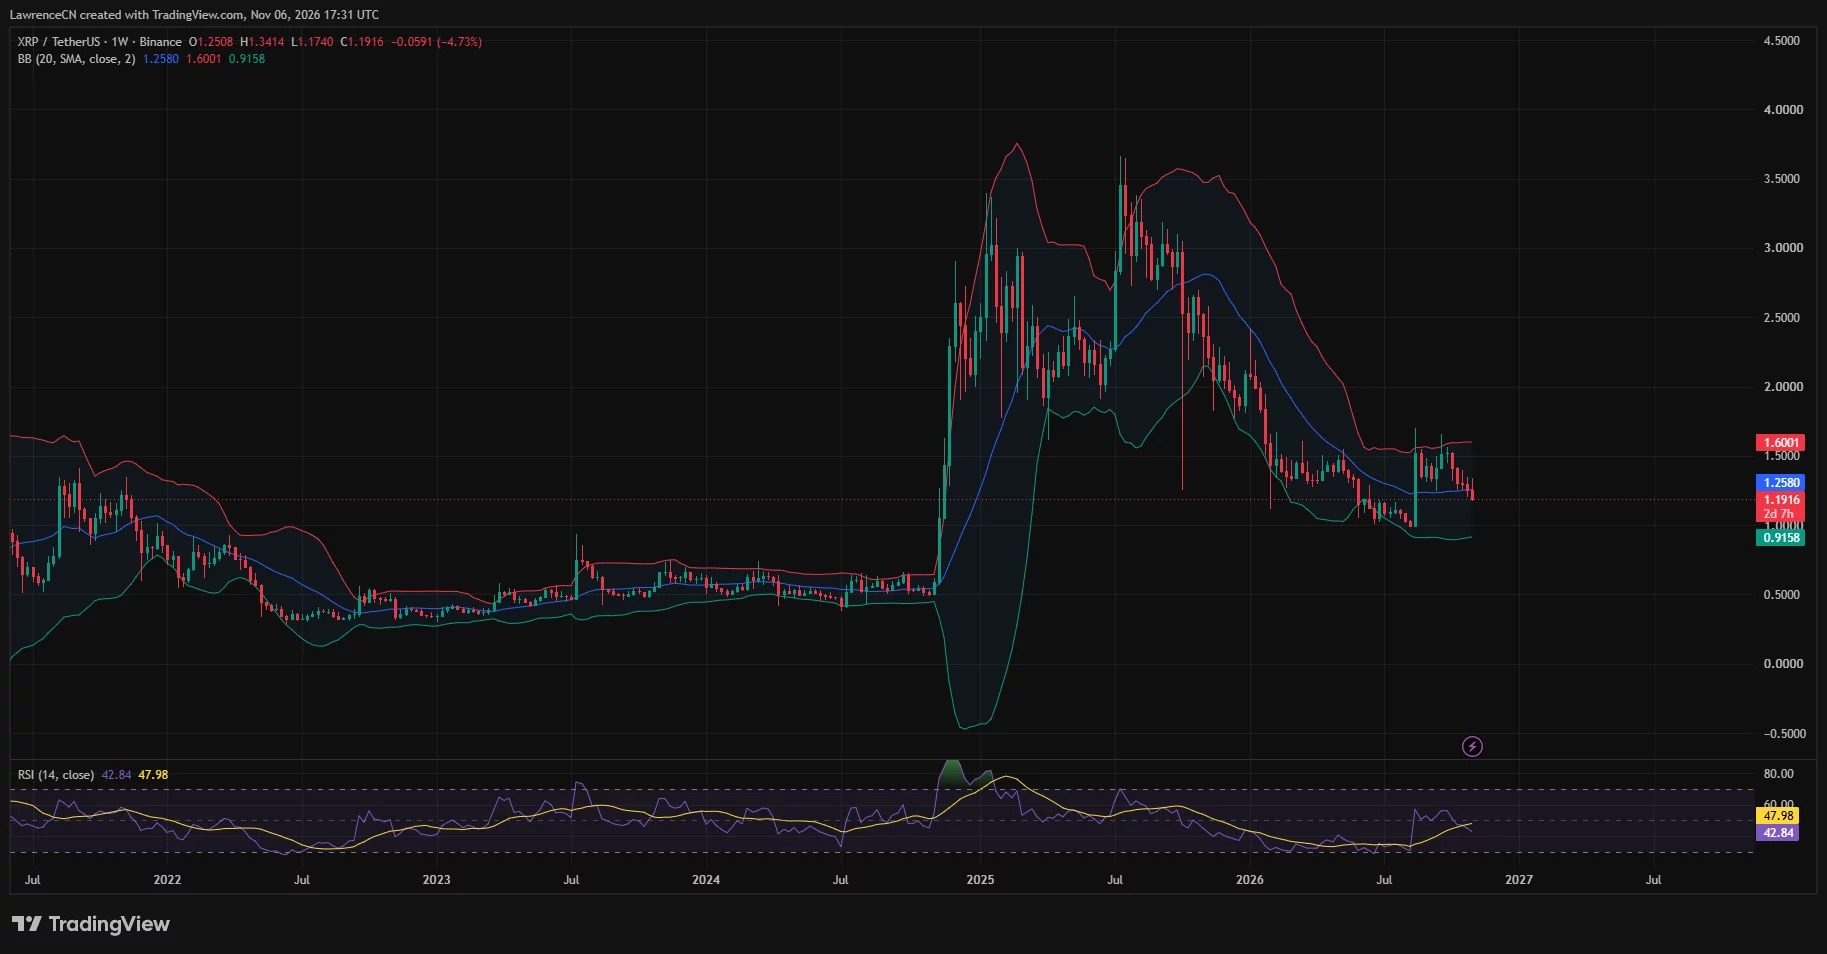
The weekly line RSI is at 42.84, which is below its average and the neutral 50 level.
Alex Marzell regards $1.20 as a watershed that distinguishes between a rebound and further decline.
Ali Charts while describing negative emotions, also mentions the possibility of a head-and-shoulders reversal pattern appearing.
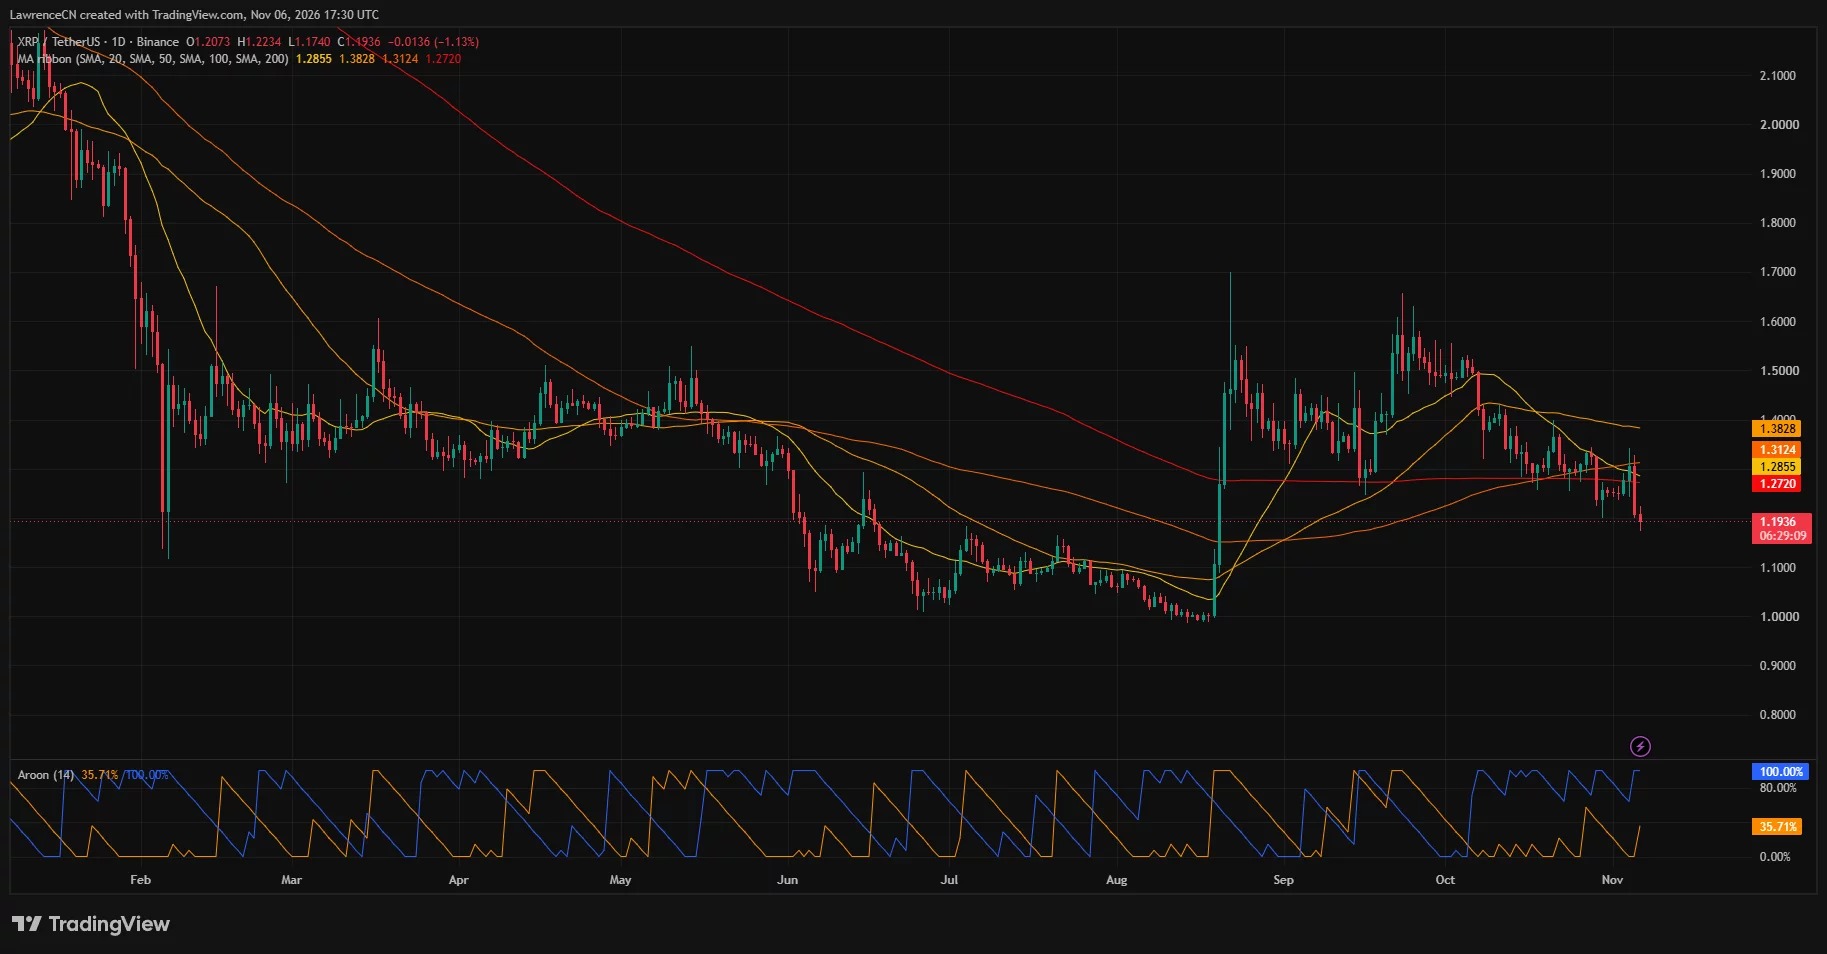
As of press time, the daily chart shows that the token is trading at $1.1936, with a lowest price of $1.1740 during the session. The daily chart indicates a 1.13% decline, while the weekly chart shows a 4.73% downward movement for the week that has not yet been completed.
XRP lost its gains again after rebounding to around $1.30
During this rebound period, Ali Martinez estimates that whales have accumulated a purchase of approximately 60 million XRP in the previous week. Santiment separately reported that the number of wallets holding at least 1 million XRP has reached 2,147, which is the highest record since 2026.
Earlier on, on November 1st, XRP added 7,934 new wallets, yet the price still hovered around $1.25 for a while. Data from Santiment was already cited in a report on November 3rd. Therefore, it seems that network growth and an increase in large wallet balances occurred simultaneously with a weakening of the price.
In a post on November 6th, crypto analyst Alex Marzell stated that XRP fell below $1.25 the previous evening, then dropped to $1.20, and broke below that level in the early morning of the same day.
"1.20 dollars is the level that determines the trend right now," he wrote.
His rebound scenario requires XRP to re-establish itself at $1.20, thereby bringing $1.22 back into focus. If that level continues to be rejected, $1.16 will become the next downward reference point; if the selling pressure continues to increase, $1.14 will be an even lower target.
XRP faces resistance around the $1.26 to $1.29 range for a rebound
On the daily chart, XRP is below the 20-day simple moving average of $1.2855 and the 200-day simple moving average of $1.2720. Both of these moving averages are above the rebound path anticipated by Marzell.
Therefore, even if the price rebounds to $1.22, it will still be below this range of resistance levels. Further above, the 100-day simple moving average is at $1.3124, and the 50-day simple moving average is even higher at $1.3828.
The price structure shows that since the rise in late September, the peak of the rebound has been gradually decreasing. The decline in November pulled XRP back to near the level it had reached at the beginning of this round of rebound.
The daily Aroon indicator further shows weakness. The Aroon Down is at 100%, while the Aroon Up is at 35.71%, indicating that within this 14-period window of the indicator, the most recent low point has occurred closer to the corresponding high point.
The weekly chart has added another level of resistance near the daily moving average. The middle band of the Bollinger Bands is at $1.2580, which is higher than the price of $1.1916 shown in the snapshot.
The weekly K-line once rose to $1.3414, before falling back to $1.1740. Since there were more than two days left until the weekly close at the time of taking the screenshot, the final closing price has not yet been determined.
Bearish sentiment accompanies unconfirmed bottom-finding theories
"Bullish trading may not have become too crowded yet," wrote the analyst, describing a potential head-and-shoulders bottom pattern that he believes the market has not yet realized.
In his earlier analysis on November 5th, he mentioned that there might be a right shoulder, with the neckline around $1.60. Only when XRP breaks through that neckline and the pattern is confirmed, will he set $2.10 as a target to watch out for.
The weekly chart shows that the rebound in September stalled near $1.60, after which prices turned downward. Currently, the upper band of the weekly Bollinger Bands is at $1.6001, and the lower band is at $0.9158.
Between the current price and the lower band is the bottom area from August of last year, around $1.00; XRP traded at that level before the rebound at the end of summer.
Disclosure: This article does not constitute investment advice. The content and materials on this page are for educational purposes only.