











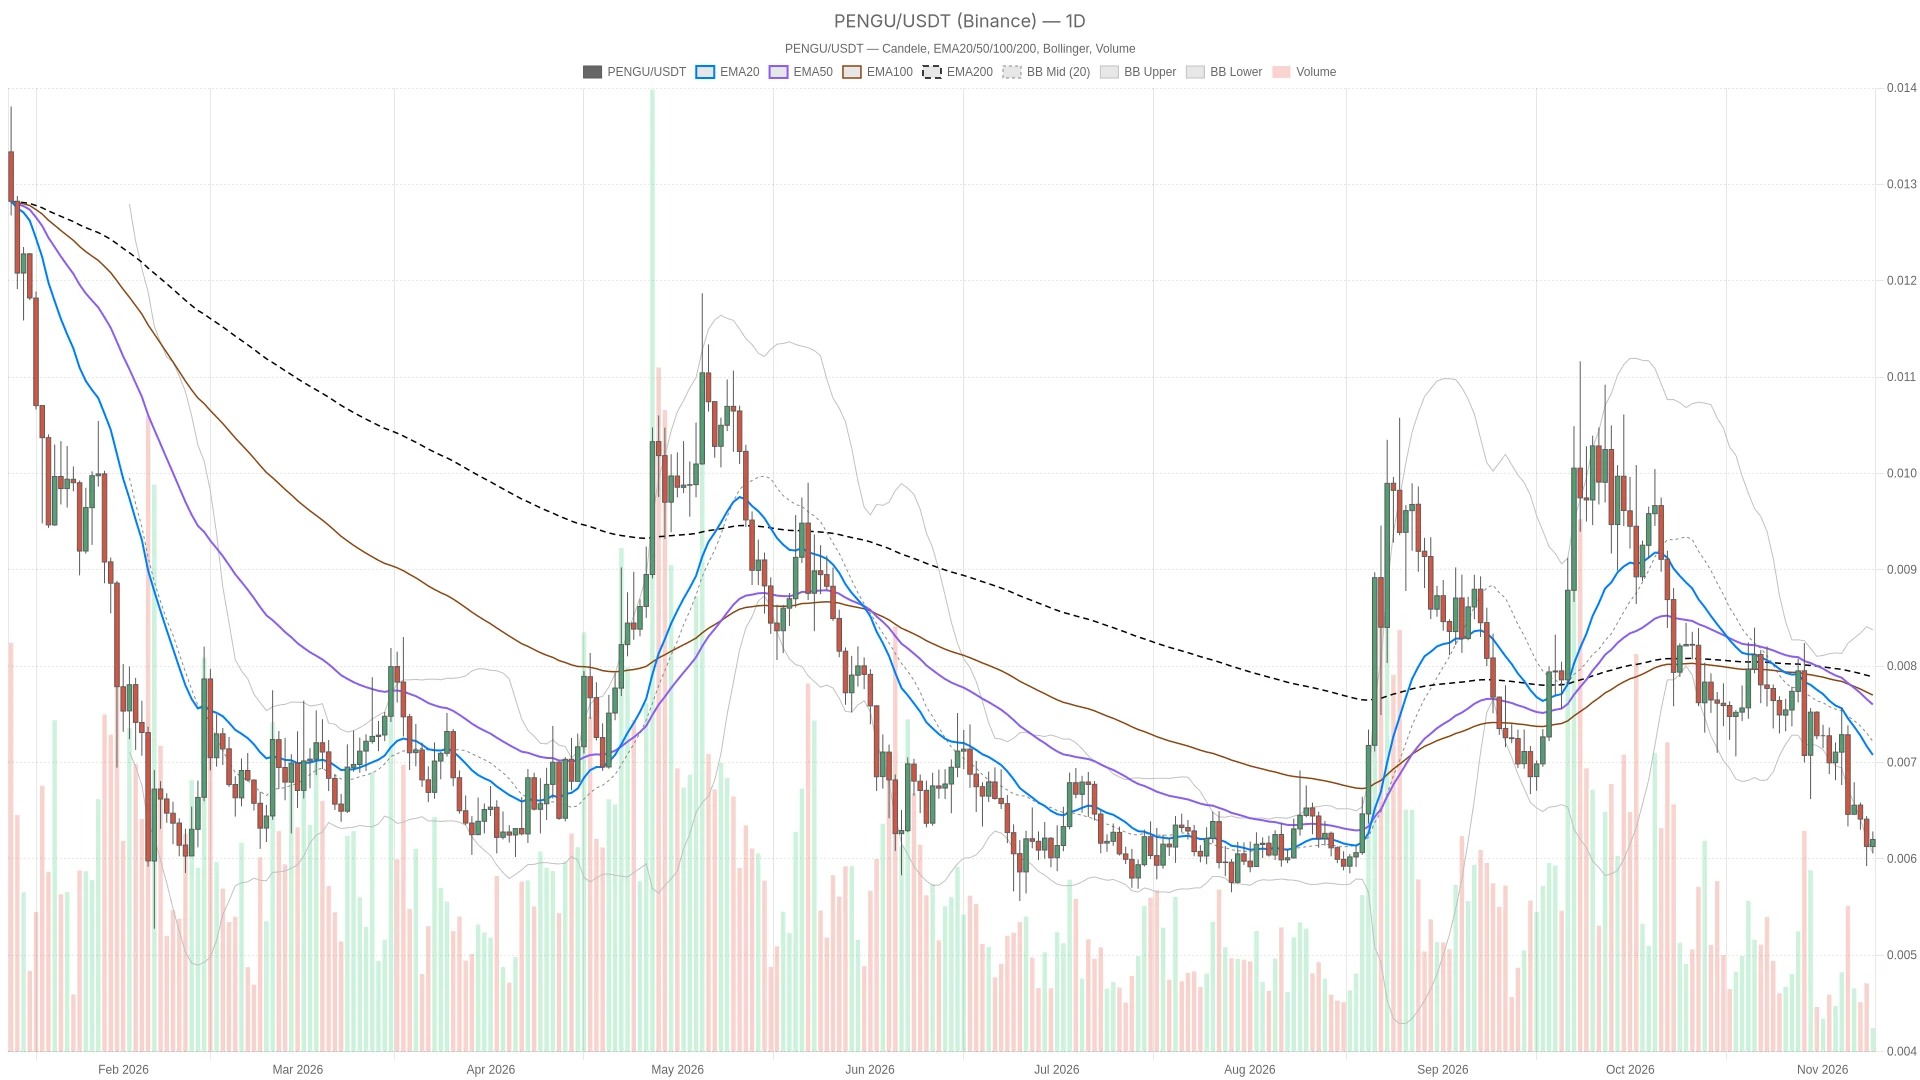
As of November 9, 2026, PENGU is trading at $0.006201 in Binance. The price of Pudgy Penguins is currently in a short-term rebound phase, while the daily trend indicates a bearish outlook.
Downward momentum still dominates: The daily and hourly charts remain bearish, and the slight improvement at the 15-minute level only supports one attempt at recovery; it does not indicate that a reversal has been confirmed.
Key Points
- PENGU reports $0.006201, with a bearish trend on the daily chart overriding the short-term rebound.
- To confirm a recovery trend, the daily closing price must exceed the lower band of the Bollinger Bands at $0.006205.
- The most recent completed daily closing price was $0.006128, which is lower than the daily pivot point of $0.006166, triggering a bearish signal.
- The daily line RSI is at 32.0 and continues to decline, while the bar chart of the daily line MACD is in negative territory and continues to widen.
The difference here is very important. The real-time trading price has once again reached the pivot point of the daily chart, but the most recent completed daily candlestick closed below it. Before the completed candlestick confirms a reversal, the stronger interpretation remains that this is just a counter-trend rebound within a larger-level weak structure.
Pudgy Penguins Price faces a daily test of recovery at $0.006205
A bullish scenario requires the daily close to be above the lower band of the daily Bollinger Bands at $0.006205. This is the recent upper threshold, and the next reference level for upward movement is $0.006406, which is marked as R1 on the daily chart. If such a close occurs, the price will return within the daily range of fluctuations, and the rebound logic will be strengthened. However, this does not mean that a larger upward trend has been established. If the daily close falls below the daily pivot point of $0.006166 subsequently, then this corrective pattern will become invalid.
Bearish trigger has actually occurred: The most recent completed daily closing price of $0.006128 is lower than the daily pivot point of $0.006166. If the current real-time rebound fails, the $0.005887 level for the daily S1 will become the next downward reference point. If the daily price closes again above the lower band of the daily Bollinger Bands at $0.006205, then this short-term downward continuation pattern will be invalidated; however, the larger-level EMA bearish structure will remain unchanged.
From an execution perspective, the price is already above the hourly level of R1 at $0.006129, so this level is now more likely to act as potential support rather than resistance. Below that are the hourly pivot point of $0.006093 and the hourly level of S1 at $0.006038. The nearest upper resistance is at the hourly level of EMA20 at $0.006232. The most likely false signal would be mistaking a brief breakout near the daily Bollinger Bands boundary for a reversal: this is a very narrow threshold, and the significance of a breakout during the session is not the same as that of a confirmation at the daily close. In either case, it does not mean that the next reference level will definitely be touched.
RSI and MACD have diverged opinions within the repair window.
RSI Only improvements at the execution level
The daily line RSI is at 32.0 and continues to decline, while the hourly line RSI is at 33.2, also continuing to fall among the completed readings. Both are approaching the oversold area, but have not yet truly entered it. Therefore, weakness remains the dominant momentum, and it is not a reason for an automatic rebound.
In the past 15 minutes, RSI has been on the rise, currently at 51.1. This indicates some improvement in the short term, but it conflicts with the larger-scale charts. As for PENGU, the speed of repair within the execution window is faster than the underlying trend itself.
MACD Maintains a more bearish stance
On the daily chart MACD, the bar chart shows negative values that continue to widen, indicating that the downward momentum is strengthening within this time frame, which determines the main direction. On the hourly chart, the bar chart has already fallen below the zero line and continues to move downward; therefore, the momentum observed at the hourly level has not yet confirmed any current rebound in real-time.
On the 15-minute chart, the bar chart has risen above the zero axis and continues to climb higher. This supports the current short-term recovery attempt, but there is a clear divergence: the short-term momentum has turned positive, while the momentum on the daily and hourly charts remains negative.
The short-position arrangement of EMA limits the rebound logic of the Bollinger Bands.
Based on the Binance data, the daily line EMA20 is at $0.007171, EMA50 is at $0.007659, and EMA200 is at $0.007906. The price is below all three, and the moving averages present a typical bearish structure. Therefore, even if there is a successful recovery in the near term, the overall daily trend remains negative.
The hourly chart structure further reinforces this judgment. The price is below the levels of EMA20 at $0.006232, EMA50 at $0.006346, and EMA200 at $0.006775, and they are also arranged in a bearish pattern. On the 15-minute chart, the price is above EMA20, near EMA50, and below EMA200; moreover, these moving averages themselves still maintain a bearish alignment. The rebound has improved the price's position, but it has not corrected the overall trend structure.
The middle band of the daily Bollinger Bands is at $0.007307, and the upper band is at $0.008409. Since the price is only slightly below the lower boundary, this seems more like an attempt to recover near the lower edge, rather than returning to the center of the daily range. On the hourly chart, the middle band of the Bollinger Bands at $0.006247 also constitutes another upper obstacle outside of the recent EMA resistance level.
On the daily chart, ATR is at $0.0005694, on the hourly chart it is $0.00008217, and on the 15-minute chart it is $0.00004518. These readings provide an indication of the scale of fluctuations behind this pattern: compared to the nearest daily boundary of the daily chart ATR, the gap is very small. This further illustrates the necessity of distinguishing between 'crossing a threshold' and 'a substantial change in structure'.
Fearful sentiment, combined with a weaker overall market, constitutes the backdrop for a rebound.
Frequently Asked Questions
PENGU is already oversold?
According to the readings provided with RSI, there is still no such situation. The daily and hourly lines RSI are approaching the oversold area, yet the 15-minute reading is still above the central axis.
Has the short-term rebound overturned the bearish outlook for the daily chart?
No. The positive momentum over a 15-minute period conflicts with the negative momentum on the daily and hourly timeframes, and the price is still below the three daily moving averages EMA. This upward movement is still considered an attempt at recovery and has not yet constituted a confirmed trend reversal.
This article was generated with the assistance of artificial intelligence and has been reviewed by an editorial team.
Lorenzo Marcek
Lorenzo Marcek is a financial journalist and senior crypto market analyst, known for his clear and data-driven reporting on digital assets. With a background in economics and over a decade of experience covering global markets, he focuses on on-chain indicators, institutional adoption trends, and macroeconomic factors that drive crypto market fluctuations. His work combines investigative journalism with insights into the technology market, making him a trusted source for traders seeking solid and actionable analysis.