Brief
U.S. stock markets rose on Monday, while oil prices fell. Traders bet that the probability of the Federal Reserve raising interest rates in December is about 80%.
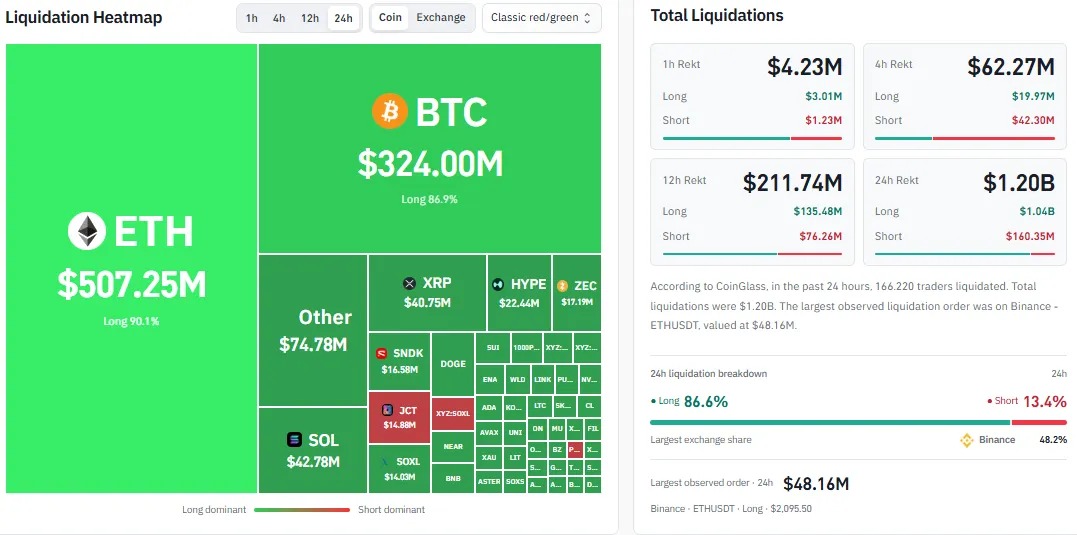
CoinGlass data shows that the settlement amount in the past 24 hours reached 1.2 billion US dollars, of which 324 million US dollars were in Bitcoin positions.
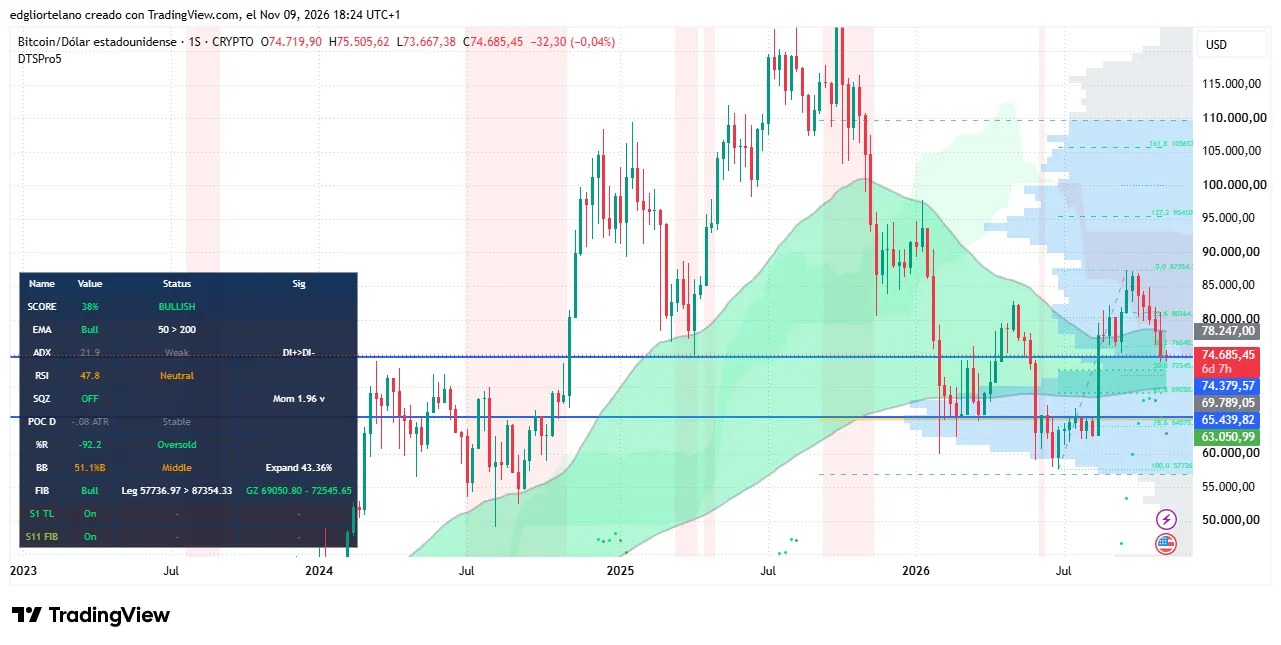
The Bitcoin weekly chart shows that there is support around $74,400, and the first resistance level is around $76,040.
After a tumultuous week in both traditional and digital asset markets, Bitcoin has returned to its levels from the beginning of August. At that time, this cryptocurrency recorded an astonishing 25% increase in just one month.
However, this time, for crypto investors, $75,000 seems a bit different, as BTC is once again on the decline. So, where will Bitcoin go next? The following chart shows what might happen next.
U.S. stock markets rebounded on Monday, with oil prices falling. As of 11:30 a.m. Eastern Time, the S&P 500 index rose by 1.9%, and the Nasdaq Composite Index increased by 2.2%. Brent crude oil dropped by 4.3% to around $94 per barrel, providing support for the overall market amid the decline in NVIDIA's stock price that alarmed tech investors.
Bitcoin's November Low
The U.S. Bureau of Labor Statistics is scheduled to release the Consumer Price Index (CPI) for October tomorrow ( CPI ). This report tracks the prices that households pay for goods and services. Following employment data that was stronger than expected, traders have priced in a 25-basis-point interest rate hike by the Federal Reserve in December at around 80%.
Bitcoin rose by 0.7% to $74,559, after previously hitting its lowest level in over two months. This rebound stems from a wave of forced liquidations in the crypto derivatives market. A CoinGlass snapshot shows that the settlement amount over the past 24 hours reached $1.2 billion.
When traders are unable to cover their losses with their collateral, the exchange will force a liquidation. Approximately $1.04 billion of this total comes from long positions, that is, positions betting on rising prices. Bitcoin positions account for $324 million, of which nearly 87% are from long holders.
Bitcoin weekly chart focuses on $74,400
Bitcoin rose from around $57,700 to $87,350, before then falling back to around $75,000. Currently, the coin is trading at $74,685, having dropped to $73,667 at the beginning of the session, and this week's candlestick chart has not yet closed.
The 50-week moving average ( EMA ) is above around $78,250, and the 200-week EMA is around $69,790. Both moving averages place more weight on recent prices, with the shorter-term moving average reacting more quickly.
Their arrangement is still conducive to a long-term upward trend. However, the current trading price of Bitcoin is below the faster-moving average, and the gap between the two has significantly narrowed, which increases the likelihood of a "death cross" occurring in the future.
The Relative Strength Index ( RSI ) is used to compare recent gains and losses within a range of 0 to 100. The current reading is 47.8, which is close to the median level and slightly favors the sellers. However, it is still some distance from 30, which traders generally consider to be an overbought condition.
On the downside, $74,400 is the first area where buyers might become involved. Bitcoin has already fallen below this level this week; therefore, if it closes below this level on a weekly chart, $72,550 will come into view, followed by the $69,000 region near the 200-week EMA.
In the event of a rebound, sellers may first try to suppress the upward trend around $76,040, followed by around $78,250, which is where the 50-week EMA moving average is located. If the price breaks through this average, $80,360 will come into focus again, and above that is the previous rebound high of $87,350.