












MARA The stock price showed a positive trend during the session, but its daily chart still indicates a bearish tendency.

MARA Holdings is still below the three-day moving average of the index. At the same time, the hourly chart provides some bullish counter signals, but a broader bullish trend has not yet been confirmed.
Key Points Summary
- As of 13:04 Eastern Time, the stock price of MARA was reported at $7.035, representing a 5.95% increase from the previous trading day's closing price of $6.64.
- The daily line RSI14 is at 41.85, which is below the neutral threshold of 50; the MACD line is at -0.89, which is still negative, but higher than its signal line.
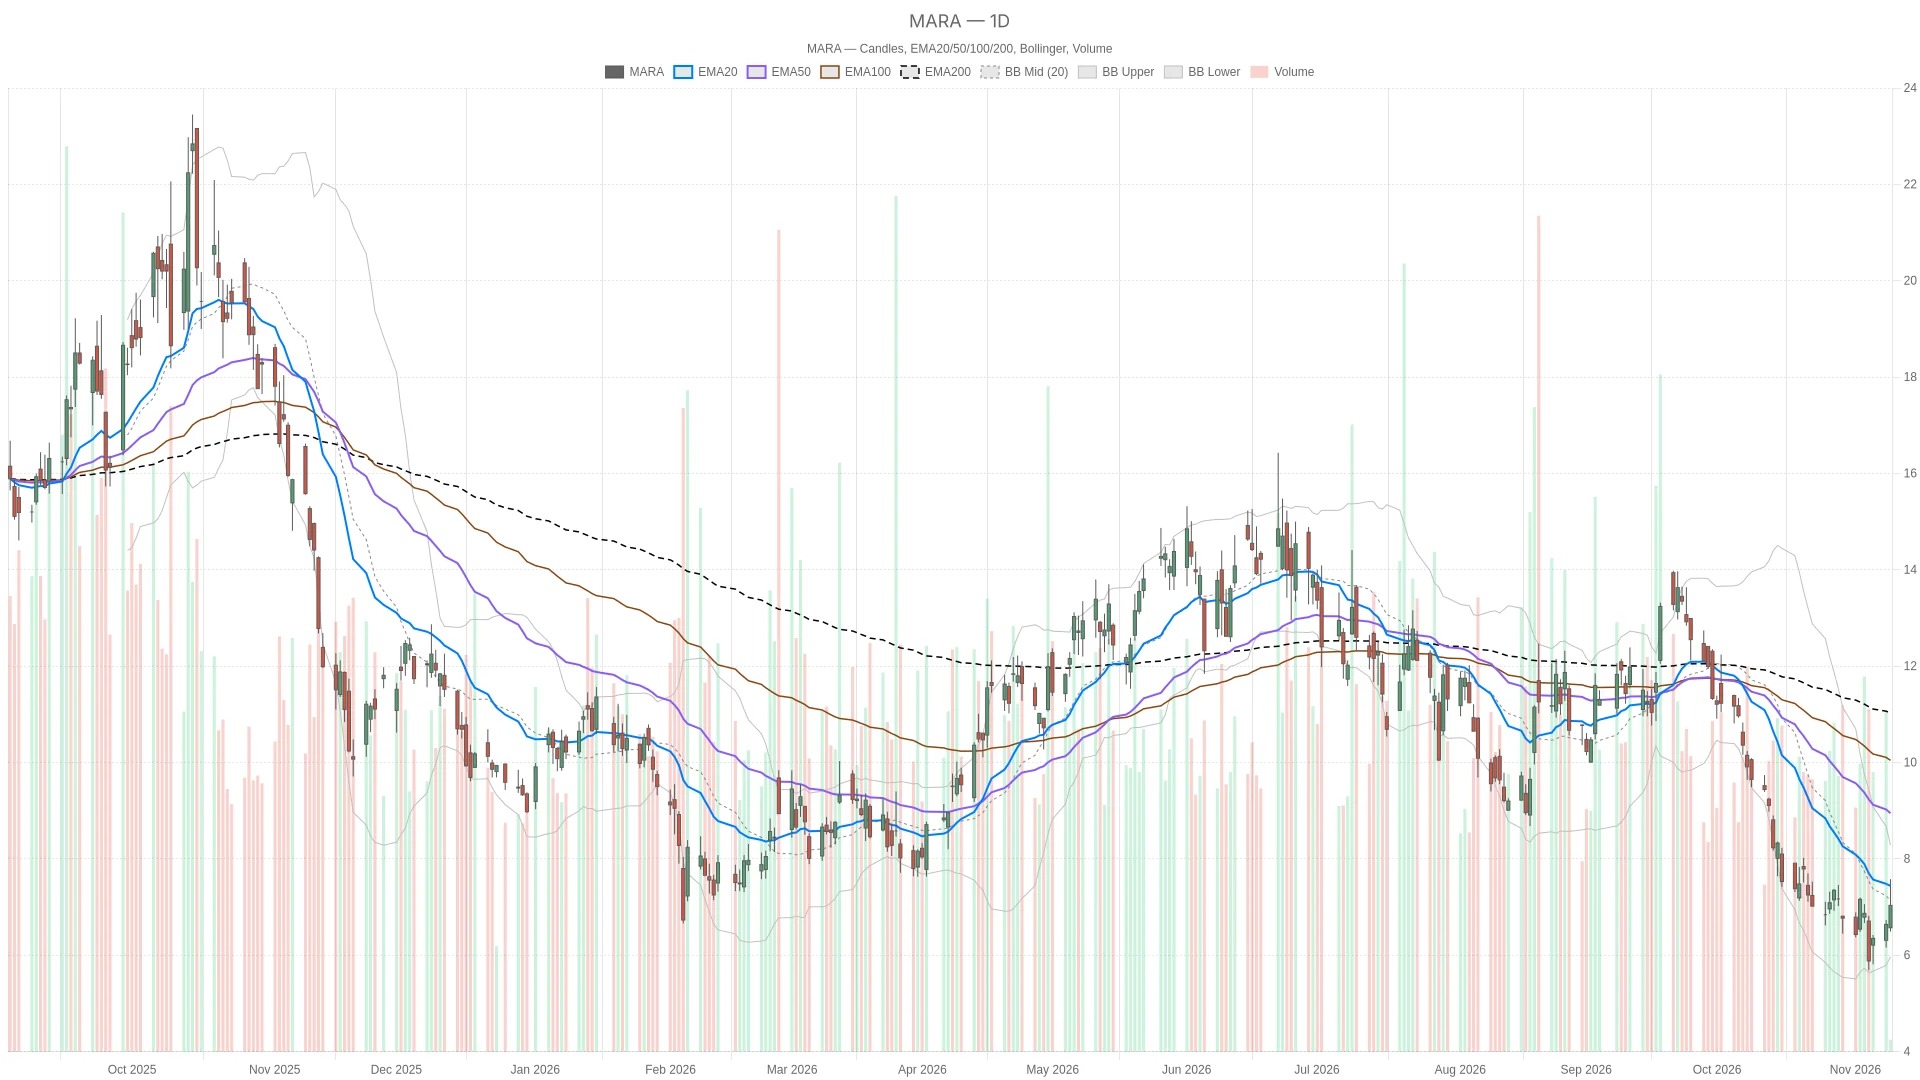
- The stock price is still below three moving averages: the 20-day average is $7.44, the 50-day average is $8.95, and the 200-day average is $11.05.
- The hourly line RSI14 is at 59.25, which is above the neutral level of 50, and the stock price is also above the 20-period and 50-period EMA levels.
- The daily chart ATR14 rose from $0.67 to $0.7.
MARA Stock Price: Daily Resistance Determines the Main Trend
On Tuesday, November 10, 2026, MARA opened at $6.57, with a low of $6.49 and a high of $7.58 during the session. As of 1:04 PM Eastern Time, the stock price was at $7.035, representing a 5.95% increase from the previous closing price of $6.64 on November 9, 2026. The text also mentions that MARA opened at $6.57 and fluctuated between $6.49 and $7.58, with the latest price being $7.04, and its previous closing price being $6.64. Since the trading session for that day has not yet ended, the daily line indicators are still considered provisional data.
The daily moving averages are in a completely bearish arrangement. The stock price is below the 20-day EMA of $7.44, with the 50-day EMA at $8.95 and the 200-day EMA at $11.05 above that. This structure indicates that the current increase is not sufficient to establish a bullish trend on the daily time frame.
However, the degree of pessimism indicated by the daily momentum indicator is lower than that shown by the moving average structure. The RSI14 indicator has risen from 37.44 to 41.85, but it is still below the neutral threshold of 50. The MACD indicator is at -0.89; although it is negative, it is higher than its signal line of -1. Its bar chart has increased from 0.06 to 0.11, indicating that although the MACD indicator is still negative, the relationship between the MACD indicator and the signal line has turned positive.
The stock price is also below the middle band of the daily Bollinger Bands at $7.13, situated between the lower band of $5.97 and the upper band of $8.29. Therefore, the middle band serves as resistance above. The daily ATR14 has risen from $0.67 to $0.7, indicating that the measured trading range has expanded compared to the previous reading.
It is worth noting that the stock price is above the daily pivot point of $6.51 and the first resistance level of $6.86. These levels are calculated based on the previous completed daily candlestick chart, and at the trading session level, they form a relatively positive contrast with the bearish EMA structure. The first support level on the daily chart is $6.29.
The strong hourly chart makes the judgment of a bearish daily chart more complex.
At the same time, the stock price is above the 20-period and 50-period EMA on the hourly chart, both at $6.68; however, it is still below the 200-period EMA on the hourly chart, which is at $8.3. In other words, the stock price is above the 20-period and 50-period EMA, but still below the 200-period EMA of $8.3.
The hourly line RSI14 is at 59.25, which is above the neutral level, but it has not yet entered the overbought range. The MACD line is at 0.16, which is 0.05 higher than its signal line, and the bar chart shows a positive value of 0.1.
The short-term trading rhythm remains divergent.
On the 15-minute chart, the stock price is above the 20-period EMA level of $7.01, the 50-period EMA level of $6.77, and the 200-period EMA level of $6.66. This arrangement only constitutes a bullish signal for the short-term trading perspective at the execution level. The RSI14 indicator is at 54.03, which is above the neutral level, but the MACD line at 0.11 is below its signal line of 0.16. The bar chart shows -0.05, indicating that the timing signals are still divergent.
In addition, although the stock price remains above the 15-minute pivot point of $7, it is still below the middle band of the 15-minute Bollinger Bands at $7.06. The first resistance level is $7.1, and the first support level is $6.92. The 15-minute ATR14 has decreased from $0.15 to $0.14, indicating that the measured short-term volatility range has narrowed.
News Background and Contextual Situation
In terms of Monday's business reports, Yahoo Finance reported on Monday that MARA's revenue decreased by 35% year-on-year to $164.2 million, falling short of the expected $176.13 million. Another report, also published on Monday, stated that MARA sold Bitcoin in the third quarter to repay loans. The report also mentioned that the company plans to further sell assets for use in AI infrastructure, convertible bonds, and share repurchases. These reports were all published before trading began on Tuesday.
Key Price Levels and Conditional Scenarios
The bullish scenario requires the stock price to hold above the 15-minute EMA pivot points of $7.01 and $7. Subsequently, it also needs to break through the 15-minute Bollinger Band middle band of $7.06 and the hourly pivot point of $7.07. Above these levels, the daily Bollinger Band middle band of $7.13 and the 20-day EMA pivot point of $7.44 represent important tests for the larger-scale trend.
On the contrary, if it falls below $7.01 and $7, it will weaken this short-term bullish structure. The next reference levels include the first support level of $6.92 on the 15-minute chart, the first support level of $6.87 on the hourly chart, and the first resistance level of $6.86 on the daily chart. If the trend continues to decline, $6.68, which is the moving average on the hourly chart, and $6.51, which is the pivot point on the daily chart, will constitute further downward reference levels.
Overall, the MARA stock price is above its daily pivot point, but below the daily median line as well as the three daily EMA levels. The daily ATR14 level is at $0.7, which indicates that volatility remains a concern. The original text suggests that the unresolved issue is whether the strength on the hourly chart will be sufficient to support the stock price in breaking through the daily resistance level before the trading session has concluded.
Frequently Asked Questions
MARA What is the current stock price?
As of 13:04 on Tuesday, November 10, 2026, Eastern Time, the stock price of MARA was reported at $7.035, representing a 5.95% increase from the previous closing price of $6.64. The trading session for that day has not yet concluded.
What are the key resistance levels for MARA?
On the daily chart, the middle band of the Bollinger Bands at $7.13 and the 20-day EMA at $7.44 represent key resistance levels. The hourly pivot point at $7.07 and the first resistance level at $7.19 also pose upward pressure.
Is the daily trend for MARA bullish or bearish?
The daily chart maintains a bearish trend. The stock price is still below the three-day moving averages and the middle band of the daily Bollinger Bands, at $7.13.
What does the hourly chart show for MARA?
The hourly chart provides some bullish hedging signals. The stock price is above the 20-period and 50-period EMA levels, both at $6.68, and the hourly line RSI14 is at 59.25, which is higher than the neutral level of 50.
Neither Cryptonomist nor the author holds any positions in the financial instruments mentioned in this text, nor have they received any compensation from the companies reported.
This article was completed with the assistance of artificial intelligence and has been reviewed by an editorial team.
Lorenzo Marcek is a financial journalist and senior crypto market analyst, known for his clear and data-driven reporting on digital assets. With a background in economics and over a decade of experience covering global markets, he focuses on on-chain indicators, institutional adoption trends, and macroeconomic factors that drive crypto market fluctuations. His work combines investigative journalism with insights into the technology market, making him a credible source that provides traders with solid and actionable analysis.