















Cango shares closed at $1.535, up 34.65% during the session. Nevertheless, the daily chart structure remains bearish, with key resistance levels at $1.58, which is EMA, and the intraday high of $1.6.
Despite a 34.65% increase during the session, the daily chart pattern of Cango's stock price remains bearish. The price is still below the key daily moving average, while the hourly and 15-minute charts indicate an overbought condition. Therefore, the short-term buying momentum contradicts the broader trend structure, and the trading session has not yet ended.
As of Wednesday, November 11, 2026, the stock price of Cango opened at $1.43 and fluctuated between $1.43 and $1.6 during the session. By 10:07 a.m. Eastern Time, the stock price was at $1.535, representing a 34.65% increase from the previous closing price of $1.14, with a trading volume of 11,643 shares at that time. The stock price of Cango opened at $1.43, reached a low of $1.43 during the session, and a high of $1.60; the latest price is $1.53, with a previous closing price of $1.14.
No specific company-level information was found in the recent reports. The existing reports do not explain the cause of this fluctuation.
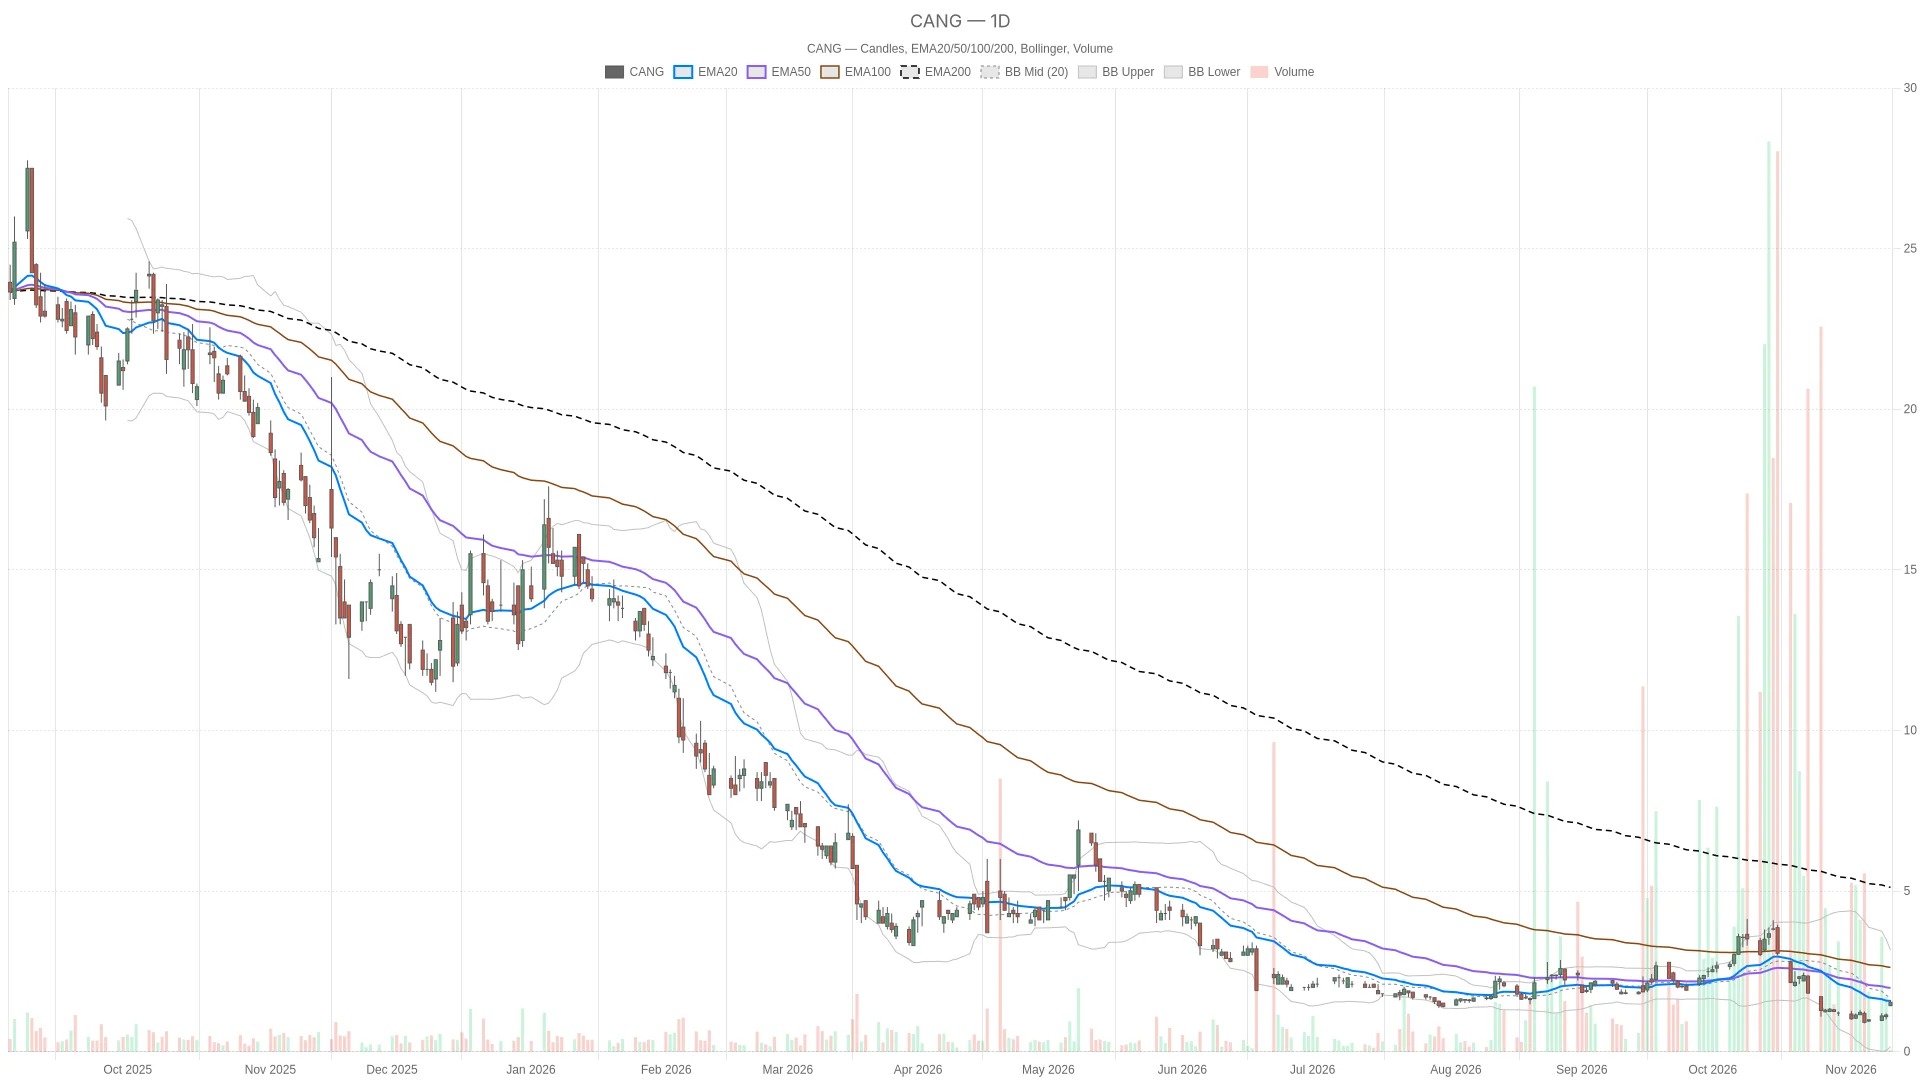
Key Points
- The daily line RSI14 is at 46.31, which is below the neutral threshold of 50; the daily line MACD is at -0.36, which is also below the signal line of -0.35.
- The stock price is still below the 1.58 USD of the 20-day moving average EMA, the 1.98 USD of the 50-day moving average EMA, and the 4.98 USD of the 200-day moving average EMA. These moving averages are in a bearish alignment.
- The hourly chart RSI14 shows a value of 74.91, which is in the overbought range; on the hourly chart MACD, the line at 0.05 is higher than the signal line at 0.01.
- The high point during the session was $1.6, and the low point was $1.43. The daily ATR14 level was $0.33.
The daily chart structure of Cango's stock price remains bearish, with the price below all three moving averages of the indices. These moving averages are arranged in a bearish pattern, and in the short term, EMA is below the long-term EMA. The stock price is also below the 1.58 dollars of the 20-period EMA, the 1.98 dollars of the 50-period EMA, and the 4.98 dollars of the 200-period EMA.
The nearest daily moving average of $1.58 remains an important resistance for a bullish scenario.
However, the daily line RSI14 is at 46.31, which is below the neutral threshold of 50, but it has not entered an oversold zone. The daily line MACD is at -0.36, which is also below the signal line of -0.35. These readings indicate that the daily momentum is not yet sufficient to confirm a strengthening trend.
In comparison, the price is higher than the daily pivot point of $1.11 and the first daily resistance level of $1.22. These levels, which are calculated based on the previous complete daily candlestick chart, are still valid during the current trading session. They are located below the current price, which supports a bullish interpretation for the session, but they are not sufficient to reverse the bearish trend indicated by the daily EMA pattern.
The strong perspective on the hourly chart conflicts with that on the daily chart.
The hourly chart shows that there is short-term buying momentum for the stock of Cango. The price is above the 20-hour EMA of $1.13 and the 50-hour EMA of $1.16, but it is still below the 200-hour EMA of $1.75. Although the price has crossed above the shorter-term moving averages, this structure does not indicate a completely bullish outlook.
It is worth noting that on the hourly chart, RSI14 is at 74.91, which is in an overbought area. On the hourly chart, the MACD line is at 0.05, which is 0.01 higher than the signal line, and on the bar chart, it is 0.04, indicating a positive value. These readings support the short-term buying momentum, forming a sharp contrast with the daily chart's momentum readings.
The price is still above the upper band of the Bollinger Bands on the hourly chart at $1.35, as well as the pivot point of $1.13 on the hourly chart. The ATR14 value on the hourly chart is $0.09. Staying above the upper band seems to indicate a continuation of the price trend, rather than confirming a change in the daily trend.
Short-term timing and conditional scenarios
The 15-minute chart provides a relatively large number of execution environments, but the overbought readings suggest caution is needed. The price is above $1.24 for the 20-period EMA, $1.15 for the 50-period EMA, and $1.12 for the 200-period EMA; therefore, this period shows a bullish trend.
However, after 15 minutes, RSI14 is at 77.74, which is in an overbought range. Its MACD line is at 0.08, which is higher than the signal line of 0.04. The price is above the upper band of the Bollinger Bands at $1.49, but below the first support level of $1.54 and the pivot point of $1.57. This combination indicates that there is positive momentum, but it is necessary to immediately regain these key levels.
The bullish scenario requires a retest of the 15-minute first support level at $1.54 and the pivot level at $1.57. The $1.58 level on the daily chart's 20-period EMA will be the next resistance level. If a breakthrough above $1.60, which is also the intraday high and the 15-minute first resistance level, occurs, this scenario will be strengthened. If the price can further stabilize above the middle band of the daily Bollinger Bands at $1.66, it will provide additional support.
On the contrary, if it falls below the upper band of the 15-minute Bollinger Bands at $1.49, the short-term bullish scenario will weaken. If it falls below the intraday low of $1.43, then the bullish scenario based on holding that level will become invalid. At that point, the upper band of the hourly Bollinger Bands at $1.35 will become the next reference level.
Overall, the stock price of Cango is still below the daily resistance level of $1.58 EMA. On the hourly chart, it is at 74.91, and on the 15-minute chart, it is at 77.74, both of which are in overbought zones. The daily resistance level is $0.33 ATR14. The unresolved question is whether a strong short-term trend can push the price above the daily resistance level before the trading session has ended.
Frequently Asked Questions
What is the key resistance level for the stock price of Cango?
The most direct resistance levels include $1.58 at the 20-day EMA on the daily chart, the intraday high of $1.60, and the middle band of the daily Bollinger Bands at $1.66. $1.75 at the 200-hour EMA and $1.98 at the 50-day EMA represent even higher resistance levels.
Cango Is the hourly chart of the stock price showing too many signals?
The hourly chart shows strength in the buy side, but it is not overwhelmingly so. The price is above the 20-hour EMA level of $1.13 and the 50-hour EMA level of $1.16, yet it remains below the 200-hour EMA level of $1.75. The hourly chart RSI14 indicates a value of 74.91, which is within the overbought range.
What is the daily price of Cango stock?
The 20-day moving average on the daily chart is EMA at $1.58, with a high during the session at $1.6, and the middle band of the daily Bollinger Bands at $1.66.
Cryptonomist and the author do not hold any positions in the financial instruments mentioned in this text, nor have they received any compensation from the companies reported.
See also: Cango Bitcoin mining performance shows a 50% decline in revenue and a net loss of 81.6 million US dollars
This article was generated with the assistance of artificial intelligence and has been reviewed by an editorial team.
Lorenzo Marcek
Lorenzo Marcek is a financial journalist and senior crypto market analyst, renowned for his clear, data-driven reporting on digital assets. With a background in economics and over a decade of experience covering global markets, he specializes in on-chain indicators, institutional adoption trends, and macroeconomic factors that influence crypto market volatility. His work combines investigative journalism with technical market insights, making him a trusted source for traders seeking solid and actionable analysis.